Will Solana (SOL/USD) Survive the Bearish Pressure? Key Things to Watch, as $100 Seems Likely
Despite staging a strong rally in 2021, Solana’s native token, SOL, has failed to replicate the same gains. It started the year on a bearish momentum that saw it plunge from a high of around $180 on the first day of 2022. At the time of writing, SOL/USD was trading at around $117.29, and looking increasingly bearish. For a crypto token that was reportedly claimed as the “Visa of Crypto” by the Bank of America on January 13, SOL/USD is now a shadow of itself, as it is trading significantly lower from the all-time high of almost $260 that it reached in November.
SOL/USD Selling Pressure at Key Level
The overall crypto market is flashing red after overnight selling that saw Bitcoin plunge to below $39,000, while Ethereum hit a level of slightly above $2,800. SOL/USD fell more than 12% at the same time. However, the decline happened after SOL/USD showed some strength around the support at $125 to $132. As other tokens showed some promising signs of a rebound, SOL/USD followed suit, jumping up to the resistance at $152. Now, having broken below $125, SOL/USD is vulnerable to further declines. It should be noted that this is the level that developed as support during the bullish rally in August last year. A break below this level means that SOL/USD could extend its declines to below $100.
– A Technical Outlook on the Daily Chart
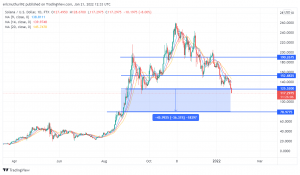 moving averages provide resistance above, while $125 could become the new resistance level. With the next potential support at $78, there is a possibility that SOL/USD could fall below $100. What Could Change for SOL/USD? Our prediction for a $100 SOL could change if several things happen in the short and medium term. False Break-out on the Daily Chart – SOL/USD’s break below the support could prove to be a false break-out if the daily candlestick closes above. Since we cannot tell for certain whether the daily candlestick will close above, we need to watch the price action in the next few hours, to see whether there will be a continuation or a reversal of the trend. If the candlestick closes above the support, it will invalidate the price expectations below $100, setting SOL/USD up for a trend reversal. Sudden Change in Sentiment – A weak sentiment in the crypto market is causing the current weakness of SOL/USD. If the sentiment changes or improves suddenly, we could see a trend change for SOL/USD, as the cryptocurrency remains an optimal choice for investors who are seeking to override the high gas fees on the Ethereum network. SOL/USD Trade Idea I maintain a bearish view of SOL/USD, as long as the weak sentiment continues and does not change in the short-term, to prove the current break below the support as a false break-out. Below $125, the next potential level is $78, although prices could also rebound at $103, as this is a level that has shown some price action before, despite not being a clear support. However, I maintain that we need to watch at the close of the candlestick on the daily chart, to identify a potential reversal that could defy a further decline in SOL/USD. Good luck!” width=”1526″ height=”890″ />
Looking at SOL/USD on the daily chart, we can see that the token is on a free-fall after breaking below $125. All the moving averages provide resistance above, while $125 could become the new resistance level. With the next potential support at $78, there is a possibility that SOL/USD could fall below $100.
What Could Change for SOL/USD?
Our prediction for a $100 SOL could change if several things happen in the short and medium term.
- False Break-out on the Daily Chart – SOL/USD’s break below the support could prove to be a false break-out if the daily candlestick closes above. Since we cannot tell for certain whether the daily candlestick will close above, we need to watch the price action in the next few hours, to see whether there will be a continuation or a reversal of the trend. If the candlestick closes above the support, it will invalidate the price expectations below $100, setting SOL/USD up for a trend reversal.
- Sudden Change in Sentiment – A weak sentiment in the crypto market is causing the current weakness of SOL/USD. If the sentiment changes or improves suddenly, we could see a trend change for SOL/USD, as the cryptocurrency remains an optimal choice for investors who are seeking to override the high gas fees on the Ethereum network.
SOL/USD Trade Idea
I maintain a bearish view of SOL/USD, as long as the weak sentiment continues and does not change in the short-term, to prove the current break below the support as a false break-out. Below $125, the next potential level is $78, although prices could also rebound at $103, as this is a level that has shown some price action before, despite not being a clear support. However, I maintain that we need to watch at the close of the candlestick on the daily chart, to identify a potential reversal that could defy a further decline in SOL/USD. Good luck!
- Check out our free forex signals
- Follow the top economic events on FX Leaders economic calendar
- Trade better, discover more Forex Trading Strategies
- Open a FREE Trading Account
- Read our latest reviews on: Avatrade, Exness, HFM and XM
Related Articles


Sidebar rates
Related Posts
