Moving Averages Join Support for SOL/USD. Bullish Momentum Starting?
Solana’s native token, SOL/USD, has moved to below $100, which was long overdue. The token faced a lot of bearish pressure after breaking below the $125-$133 area, which previously acted as the support. Our previous outlook suggested that SOL/USD was heading below $100 and up to the $78 area, given the bearish pressure. The proclaimed Ethereum killer proceeded up to the low of $80.9, just slightly above our forecast. Although this decline was connected to the overall weakness in crypto, the Solana network’s specific issues were also to blame. Network outages, with the latest being on January 23, contributed to the decline, as users got frustrated over heavy liquidations that lasted for about two days.
Having dropped to the $80 level, SOL/USD is now making a comeback. At the time of writing, it was trading at $96.50, and it was up by 4.8% in the last 24 hours. The recent gains come when other cryptocurrencies are also turning green again. Reports that non fungible marketplace OpenSea is seeking to integrate Solana, together with the Phantom Solana wallet, also boosted the price. This is positive news, as sales of NFTs on the Solana network topped $1 billion for the first time in January, showing how crucial related developments are to the blockchain’s native token, SOL. Following the bullish impetus, technical indicators support a bounce back above $100 for SOL/USD.
– Moving Averages Join Support on the 4-Hour Chart
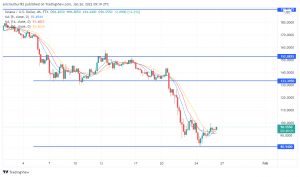 On the 4-hour chart, SOL/USD is seen rebounding from $80.9. All the moving averages have joined the support, which means that they could push SOL/USD higher. There are further bullish indicators on the daily chart.
Forms a Bullish Reversal Signal at $80.9
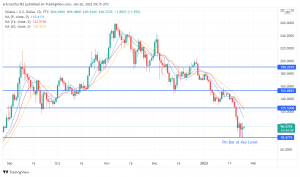
On the daily chart, SOL/USD has formed a bullish pin bar at $80.9, which is now turning into a support area. The token is consolidating at this level, with buyer interest revealed by the bullish reversal signal, suggesting a price rejection below $80.9. The moving averages are yet to join support, but this should not be interpreted as a bearish market, as the price is still reeling from the bearish move that began in November. However, the moving averages could still offer some resistance in the upside move, with short-market corrections likely on the way up.
SOL/USD Trade Idea
I recommend a buy trade on SOL/USD,based on the developing fundamentals and technical indicators, which suggest a potential rebound. However, based on the daily chart, SOL/USD is likely to face resistance at $125.5, before witnessing any further upside. Therefore, I would watch that level, which could turn into resistance, and take profits accordingly. Other levels to watch for price action are $133, $152, and higher up to $190. Good luck!
- Check out our free forex signals
- Follow the top economic events on FX Leaders economic calendar
- Trade better, discover more Forex Trading Strategies
- Open a FREE Trading Account
- Read our latest reviews on: Avatrade, Exness, HFM and XM
Related Articles


Sidebar rates
Related Posts
