Buying USD/CAD Despite Oil Increasing Above $100
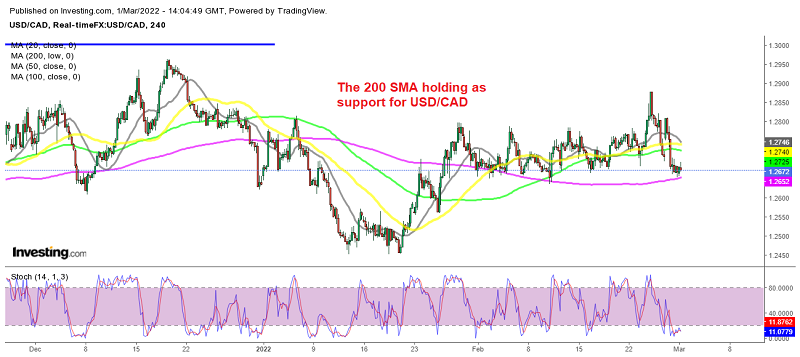
We decided to buy the pullback in USD/CAD after finding support at the 200 SMA
Crude oil continues to rally, due to the conflict in Ukraine, and it has picked up pace since yesterday. The market opened with a bullish gap yesterday, and today it is continuing the uptrend. US WTI has finally made it above $100, and it is staying above that big round level, after failing to do so last week.
Global manufacturing is in a good shape as well, which keeps the demand for crude oil high, while OPEC+ is likely to stick with existing policy in this week’s meeting, according to a Reuters report, which cited two OPEC+ sources. According to these sources, the Russia-Ukraine war has not affected the functioning of the OPEC+ deal so far. Well, to be fair that is what the market has pretty much anticipated in any case. As a reminder, the policy meeting will take place on Wednesday.
Crude Oil H4 Chart – Holding Above $100

The 100 SMA held as support
USD/CAD declined as crude oil increased higher, but the 200 SMA (purple) is holding as support on the H4 chart, as shown on the chart at the top of this article. The stochastic indicator is now oversold, while the GDP report from Canada, which was released just a while ago, showed that the economy fell flat, at 0.0%, in December. So, we decided to open a buy signal on this pair above the 200 SMA.
Canada December GDP Report
- December GDP MoM 0.0% vs 0.1% expected
- GDP YoY for Q4 6.7% vs 6.5% estimated
- GDP Q4 2021 annualized for Canada 6.7% vs 6.5%
- The advanced estimate was for an annualized rate of 6.3%
- GDP Q4 1.6% vs 1.3% in Q3. The advance estimate was 1.6%
- GDP December 2021 0.0% vs 0.1% estimate. The advanced estimate for December was unchanged.
- GDP Implicit Price QoQ 1.6% %
- GDP YoY Q4 (not annualized) 3.26% vs 3.97% last
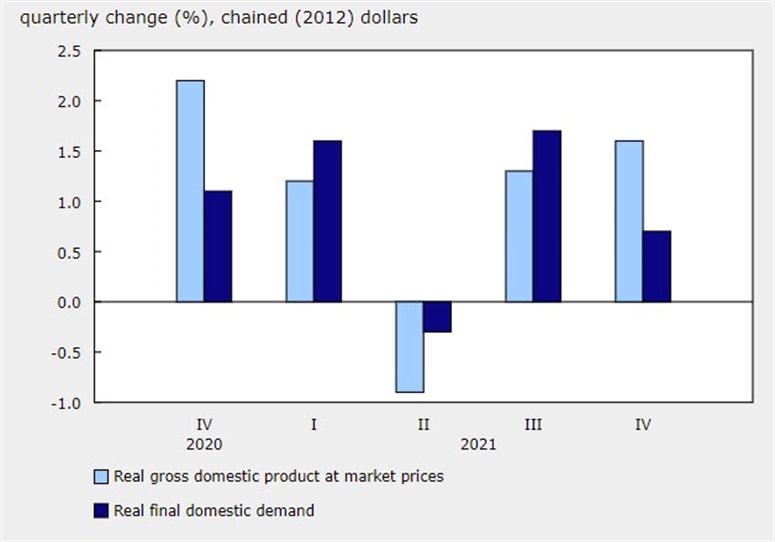
- Final domestic demand rose by 0.7% in the fourth quarter, after rising by 1.7% in the previous quarter
- The flash estimate for January is shooting for 0.2%.
US WTI Crude Oil Live Chart
- Check out our free forex signals
- Follow the top economic events on FX Leaders economic calendar
- Trade better, discover more Forex Trading Strategies
- Open a FREE Trading Account


