Stock Markets Keep Resuming the Larger Uptrend, as the Sentiment Improves
Written by:
Skerdian Meta•Monday, March 21, 2022•3 min read
•Last updated: Monday, March 21, 2022
Stock markets took a beating during the first two months of this year and the first half of March. Along with the global finance crash of 2008, this has been one of the biggest pullbacks. One of the main reasons for this dramatic retreat was central banks turning hawkish. In 2021, inflation surged across the world, everywhere, that is, except China, and so far this year, the situation has become worse, as prices keep increasing at an enormous pace.
This has forced central banks to bring an end to the QE stimulus programs and start increasing interest rates. Some of the cash that was spent during these programs spilled into stock markets, and now that it is drying up, the sentiment has turned negative, and stocks, particularly tech stocks,were retreating until a week ago.
The other reason which has hurt the risk sentiment around the world is the conflict in Ukraine. The sanctions on Russian oil by the US sent the sentiment diving, particularly in Europe, where investor sentiment has turned negative, accelerating the decline in the main indices earlier this month. But, it seems like things might calm down, so the sentiment has improved, and stock markets are reversing higher.
S&P500 Daily Chart Analysis – Will MAs Turn Into Support Again?
S&P500 is now facing MAs as resistance above
S&P500 has climbed from a low of $4,100 points, to 4,460 points, although now it has to take out moving averages, which were keeping it supported during the bullish period on the daily chart. Now, this index is moving above the 200 SMA (purple) and most importantly the 50 SMA (yellow) which have acted as support before.
However, central banks are still tightening and probably faster, as inflation keeps surging. Last week, the FED decided to start hiking by 0.25%, and expectations are for plenty more hikes after the statement and Powell’s speech.
FED Rate Hike and Dot Plot Table
The FED hiked from 0.25% to 0.50%, although the main takeaway from the Fed decision was 7 hikes in the dot plot for this year, versus about 5, which most economists were flagging. That led to an initial push higher in front-end rates and a 60% implied probability of a 50 bps hike in May at the next meeting.
But the USD started turning lower as Powell started to speak. I can’t tie that move to anything he said. Perhaps there were some people looking for a clear nod to 50 bps or a faster pace of hikes, but I find that thinking to be a stretch. It is more likely that it was a reversion to the earlier theme, revealing that dip buyers have been waiting for the FED risk to pass. We’ve seen that before, but it will take the week to sort out whether it’s real, or just a temporary blip.
For March 2022, the median rate at the end of 2022 was 1.9%, vs 0.9% in December. That means seven hikes in 2022, which is congruent with the market, but above expectations from the Fed. In 2023 the expectations are for 2.8%, vs 1.6% median (and 11 of 18 at 1.9%) in December. They also expect 2.8% in 2024.
FOMC dot plot from March 2022
The Dot Plot in December was as follows:
The Dot Plot from December 2021
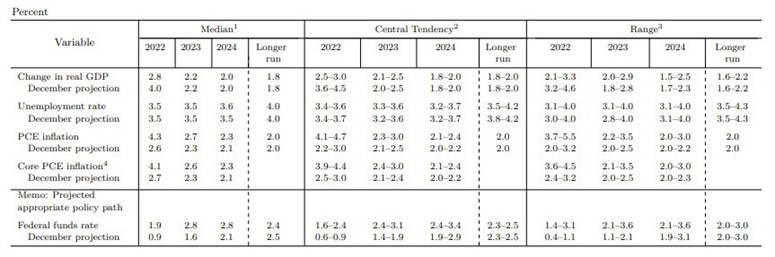
The table of the central tendencies from March 2022 is as follows:
Central tendencies from March 2022 meeting
Summary of central tendencies from March, compared to December, now showing for 2022:
GDP lowered to 2.5% to 3.0%, from 3.6% to 4.5% in 2022
Unemployment rate nearly unchanged at 3.4% to 3.6%, from 3.4% to 3.7% in 2022
PCE inflation much higher at 4.1% to 4.7%, from 2.2% to 3.0% in 2022
Core PCE inflation much higher at 3.9% to 4.4%, from 2.5% to 3.0% in 2022
Expected figures for 2023:
GDP nearly unchanged at 2.1% to 2.5%
Unemployment rate almost unchanged at 3.3% to 3.6%
PCE inflation higher at 2.3% to 3%, from 2.1% to 2.5% in December
Core PCE inflation higher at 2.4% to 3%, from 2.1% to 2.4% in December
Skerdian Meta Lead Analyst.
Skerdian is a professional Forex trader and a market analyst. He has been actively engaged in market analysis for the past 11 years. Before becoming our head analyst, Skerdian served as a trader and market analyst in Saxo Bank's local branch, Aksioner. Skerdian specialized in experimenting with developing models and hands-on trading. Skerdian has a masters degree in finance and investment.


 FOMC dot plot from March 2022
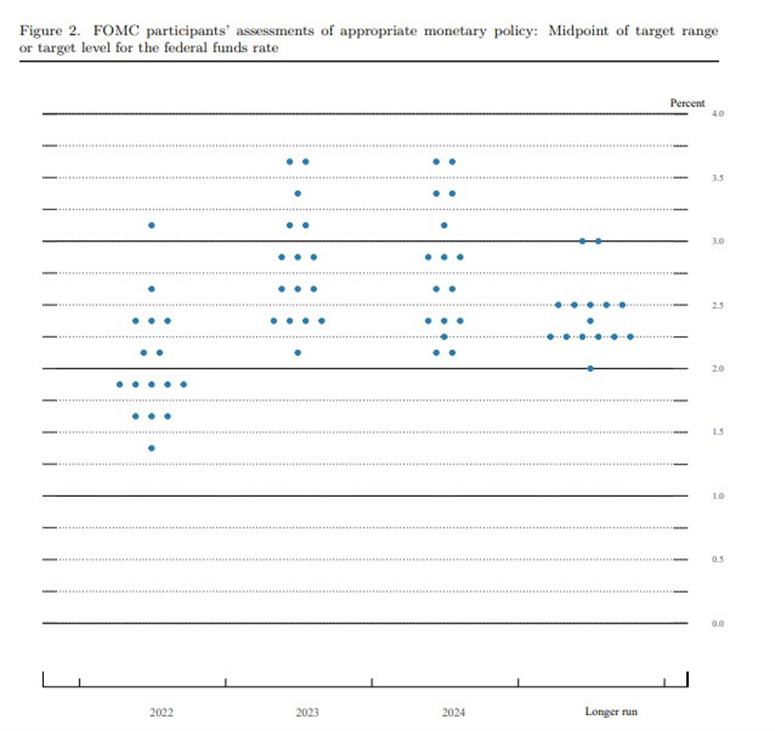 FOMC dot plot from March 2022
 The Dot Plot from December 2021
 The Dot Plot from December 2021