Ethereum Price Prediction – Double Bottom to Drive Uptrend Above $2.7K
Ethereum was attempting, albeit modestly, to move higher. The price action has been tight as ETH's range of trading remained between $2800
Ethereum was attempting, albeit modestly, to move higher. The price action has been tight as ETH’s range of trading remained between $2800 and $2900, respectively. Prices have repeatedly attempted to retest the $2900 level, but have been rejected by the aforementioned level.
Sellers have currently lowered the asking price below $2900. Over the last week, ETH dropped over 7 percent. However, in the past 24 hours, the king of altcoins showed indications of recovery. The coin experienced a 1% price increase. This development could make it possible for the bulls to re-enter the market.
It is a good indicator that the bulls have been buying at lower price levels for the altcoin. This suggests that prices will likely rise in the coming trading sessions. On the one-day chart, ETHEREUM flashes an ascending triangle.
At the time of writing, the price of Ethereum was $2871. Its immediate level of resistance was around $3028. Throughout the prior trading sessions, ETH lost energy and became rejected from the $3000 price barrier. The coin displayed signals of good price action as the volume transacted was seen in green as the closing price was higher than the previous session.
If ETH manages to push its way higher, then it might break beyond the $3000 level and trade close to $3263. On the downside, the local support level for the coin was at $2794 and the next support level if this fails is at $2437.
The king altcoin represented an ascending triangle, which is deemed to be bullish. A positive continuation pattern with an ascending triangle has a rising lower trendline and a flat upper trendline. Buyers at present have sought to overcome sellers as ETH continues to record higher lows.
Technical Analysis of Ethereum
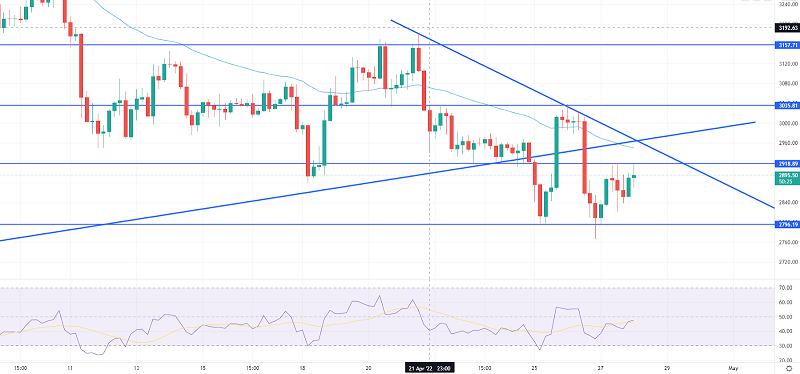
Ethereum’s purchasers have been trying to re-enter the market on the four-hour chart. The ETH/USD pair on TradingView is the source of this image. Ethereum’s quick bounce could try to push prices over the 20-SMA line. At the moment, ETH was trading beneath the 20-SMA line, which signifies sellers have taken over the market in the short term.
It has to be recalled that buyers had forced ETH’s prices to trade above the 20-SMA barely 24 hours ago, even when prices were decreasing. This reading showed that purchasers had been aggressively buying the asset at lower price levels in anticipation that prices would increase.
On the Relative Strength Index, even though the indicator was put below the half-line, it observed a modest upswing. An increase confirms that buyers may be returning to the market. Good luck!
- Check out our free forex signals
- Follow the top economic events on FX Leaders economic calendar
- Trade better, discover more Forex Trading Strategies
- Open a FREE Trading Account
- Read our latest reviews on: Avatrade, Exness, HFM and XM
Related Articles


Sidebar rates
Related Posts
