Bitcoin Struggles Under 23.6% Fibonacci Retracement – Daily Technical Outlook
Bitcoin struggled to break through the $21,500 resistance against the US dollar. BTC is reversing its gains and could find support near the
Written by:
Skerdian Meta
•
Wednesday, June 22, 2022
•
2 min read
•
Last updated: Wednesday, June 22, 2022
Bitcoin struggled to break through the $21,500 resistance against the US dollar.
BTC is reversing its gains and could find support near the 100 hourly SMA. Before facing sellers, Bitcoin had risen above the $21,500 mark. The price has now risen above the $20,000 mark and the 100 hourly simple moving average. On the hourly chart of the BTC/USD pair, there was a break below a key bullish trend line with support near $21,175. Bids could be found near the $20,000 mark or the 100 hourly simple moving average.
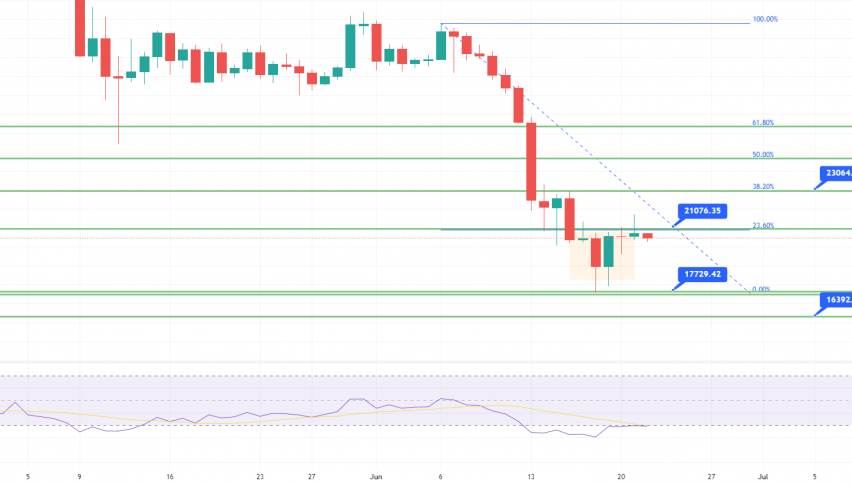
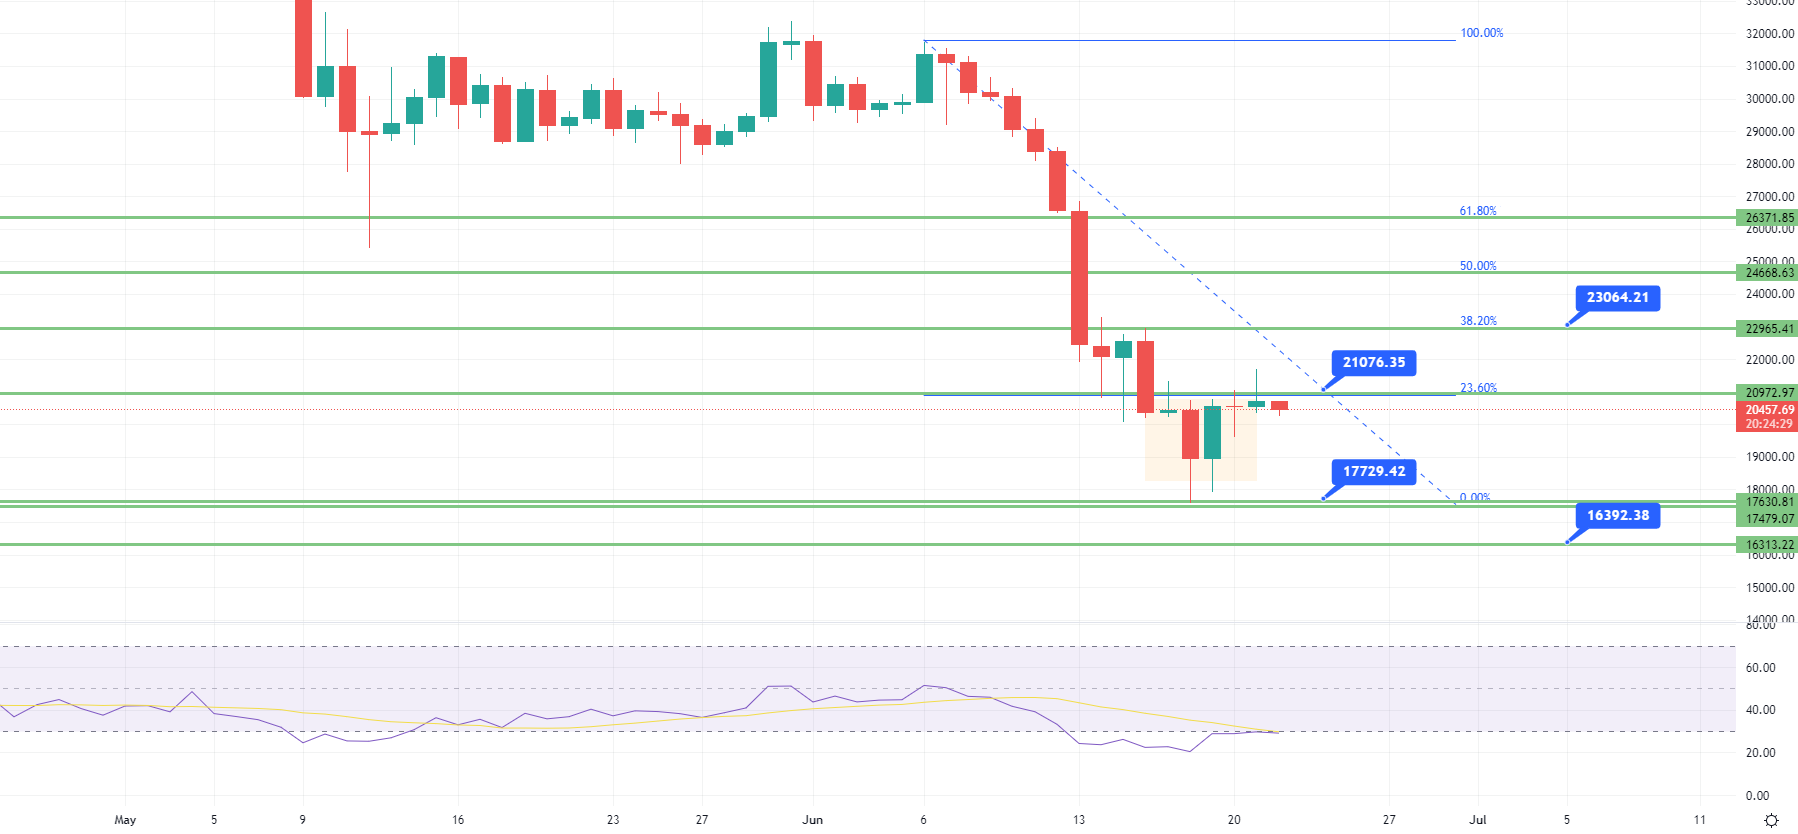
Bitcoin has begun an upward correction above the $20,000 resistance level. Above the $20,200 and $20,500 levels, there was a decent recovery wave. The price increased to the 61.8 percent Fib retracement level of the key downside movement from the high of $22,950 to the low of $17,600.Finally, the price broke through the $21,000 resistance zone and settled above the 100 hourly simple moving average.
The bears, on the other hand, were active above the $21,500 level. A high was formed near $21,698, and the price began a downward correction. The upward move from the swing low of $17,600 to the high of $21,698 was broken below the 23.6 percent Fib retracement level. Furthermore, on the hourly chart of the BTC/USD pair, there was a break below a key bullish trend line with support near $21,175.
The price has dropped below $21,000. On the upside, immediate resistance is near the $20,550 level. The first significant resistance is located near the $21,000 and $21,220 levels. A clear move above $21,220 may necessitate a move to $21,700. Any further gains could push the price to $22,200 in the coming sessions.

More Bitcoin losses?
If Bitcoin fails to break through the $21,220 resistance level, it may continue to fall. On the downside, immediate support is near the $20,000 level and the 100 hourly SMA. The next major support is around $19,650. It is close to the 50% Fib retracement level of the upward move from the swing low of $17,600 to the high of $21,698. A break below the $19,650 support level could relaunch the downtrend in the near term.
Skerdian Meta
Lead Analyst
Skerdian Meta Lead Analyst.
Skerdian is a professional Forex trader and a market analyst. He has been actively engaged in market analysis for the past 11 years. Before becoming our head analyst, Skerdian served as a trader and market analyst in Saxo Bank's local branch, Aksioner. Skerdian specialized in experimenting with developing models and hands-on trading. Skerdian has a masters degree in finance and investment.
Related Articles