Forex Signals Brief for August 5: GBP Dives After BOE’s 50 BPS Hike, US Employment Coming Up

Yesterday’s Market Wrap
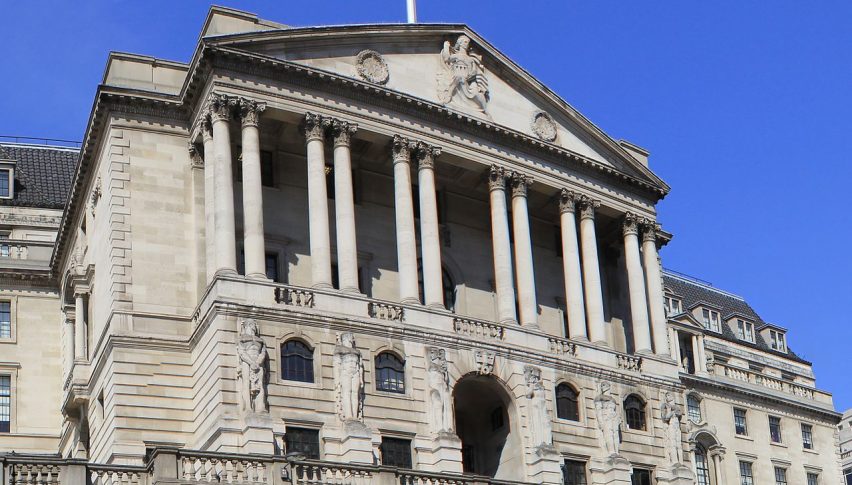
Yesterday the attention was on the Bank of England meeting which was expected to deliver the sixth interest rate hike in a row and the first one worth 50 bps (basis points). They satisfied expectations and raised rates to 1.75%, but the economic and inflationary forecasts from the BOE was quite dire, which sent the GBP lower after the rate decision.
BOE’s Bailey said in the press conference that the UK is forecasted to enter recession later in the year. The BOE warned of the longest recession since the global financial crisis and also provided a subtle shift in guidance à la the RBA i.e. “not on a pre-set path“, which points to a slowdown in rate hikes and they are not wrong about this. Early this morning the construction PMI report showed that this sector fell in contraction in July.
The meeting minutes from the Reserve Bank of Australia were released early this morning, repeating the stance that the RBA held in the last meeting, which means that future rate hikes won’t be set in stone, unlike in the last several meetings. German and French industrial production declined in June, while in the afternoon we have the employment and earnings reports from the US and Canada. US WTI crude Oil continued lower yesterday, falling below $90 per barrel for the first time since the conflict in Ukraine started.
Forex Signals Update
The volatility and uncertainty continued for most financial markets yesterday, with the USD unable to follow up on the previous day’s bullish momentum. We took advantage of the bearish momentum in crude Oil though, opening a few signals there, all of which closed in profit.
EUR/USD Sell Signal
EUR/GBP GBP has been bearish since the beginning of July, as Euro weakness increased on deteriorating consumer and investor sentiment in the Eurozone. Moving averages were acting as support at the bottom, but they have turned into resistance and the 20 SMA (gray) has taken over recently, indicating decent selling pressure on this pair. We decided to open a sell forex signal here below this moving average, during the retrace higher yesterday ahead of the Bank of England meeting today.

EUR/GBP – 60 minute chart
GOLD – 2 Buy Signals
Gold has turned bullish for a couple of weeks as the uncertainty prevailed, keeping the sentiment bullish for XAU. Yesterday we opened two buy signals as the bullish momentum continued. The first signal closed in profit as the upside momentum continued in the European session, but we got caught with the second Gold signal as the price retreated more than 100 pips lower.

XAU/USD – 60 minute chart
Cryptocurrency Update
Cryptocurrencies were showing buying pressure on Wednesday, but yesterday they resumed the bearish momentum as the retreating period continues. Ethereum and Bitcoin retreated off the resistance indicators earlier this week, but we are following them to buy lower later this week.
The 20 SMA Still Holding As Support for BITCOIN
Bitcoin stopped climbing since it crashed below $200 in June, and has been making higher lows since then. BTC has formed a bullish channel and moving averages have now turned into support, as BTC keeps making higher highs too. In the last several days we were seeing the crypto market retreat lower, but the retreat has ended at the 20 SMA (gray) for Bitcoin, which is another bullish sign as buyers are jumping in before reaching the bottom of the channel. We are already long on Bitcoin, so we’re holding on to our signal here.

BTC/USD – Daily chart
ETHEREUM Getting Squeezed Between 2 MAs
Ethereum fell below $1,000 in June during the last crypto crash but turned bullish by the middle of July. Buyers pushed above the 50 SMA (yellow) which was the first bullish signal and after the first failure at the $1,700 support and resistance level, ETH/USD pushed above it, as the 20 SMA (gray) turned into support. But the 100 SMA (green) continues to act as resistance at the top, although chances are that ETH will push above it soon as the price remains stuck at this moving average.

ETH/USD – Daily chart
- Check out our free forex signals
- Follow the top economic events on FX Leaders economic calendar
- Trade better, discover more Forex Trading Strategies
- Open a FREE Trading Account


