Bitcoin Breaking Above $24,000 – Buyers Brace for $25,500
Bitcoin established stability at over $22,500 and increased by more than 6% versus the US dollar. BTC has overcome several obstacles and may
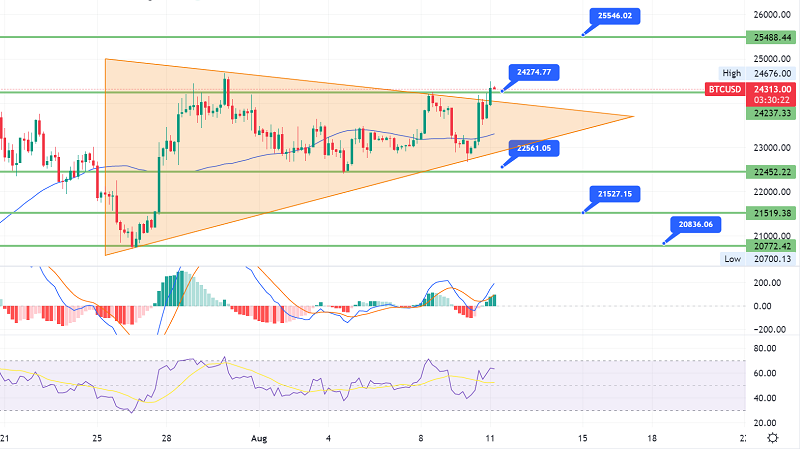
Bitcoin established stability at over $22,500 and increased by more than 6% versus the US dollar. BTC has overcome several obstacles and may continue to surge towards the $25,000 barrier level. BITCOIN began a new uptrend after finding strong offers above $22,500.
The price currently trades above the $23,500 mark and the 100 hourly simple moving average. On the hourly chart of the BTC/USD pair, there was a break over a critical negative trend line with resistance above $23,350. The pair is building a bullish breakout pattern and may surge above $25,000 in the near future.
Bitcoin Price Breaks Through Resistance
Bitcoin’s price has been comfortably sustained at over $22,500. BTC created a double bottom pattern near $22,500 and began a strong rise.
The price broke through the $23,000 and $23,500 barrier levels. The price even broke through the $24,000 barrier. On the hourly chart of the BTC/USD pair, there was a break over a critical negative trend line with resistance above $23,350.
Bitcoin price went beyond the $24,200 barrier and soared as high as $24,488. It has now begun to consolidate gains over the $24,200 support level. It is also far above the 23.6% Fib retracement level of the upward run from the swing low of $22,685 to the high of $24,488.
On the upside, an immediate resistance level is at $24,450. The next major resistance level is at $24,500. A closing above the $24,500 resistance level might trigger another rise. In the above scenario, the price may advance to the $25,000 barrier level.
Dips in Bitcoin Limited?
If Bitcoin fails to break over the $24,500 resistance level, it may correct lower. On the downside, there is immediate support at the $24,200 level. The next significant support is now close to around $24,000.
If the bears drive the price below the $24,000 support level, it may fall to the $23,550 level. It is close to the 50% Fib retracement level of the upward advance from the swing low of $22,685 to the high of $24,488. Any further losses might push the price below the $23,450 level or the 100 hourly simple moving average.
- Check out our free forex signals
- Follow the top economic events on FX Leaders economic calendar
- Trade better, discover more Forex Trading Strategies
- Open a FREE Trading Account