Crude Oil Reverses at the 50 SMA, Despite Positive Fundamentals This Week
Crude Oil was on a long-term bullish trend, with the US WTI crude increasing to $130 by early May, but it reversed in the middle of June and has been bearish since then. The US economy fell into a recession in Q1 and Q2 of this year, the Eurozone is heading there, particularly with the energy prices surging and China is having its own problems too.
But Oil turned higher this week, as some fundamentals in the US showed a stable conomy. In Europe Gas prices are surging which is pushing consumers toward Oil, helping keep the bullish momentum this week. Although, we saw a rejection at the 50 SMA (yellow) yesterday on the daily chart, so we decided to open a sell Oil signal.
US WTI Oil Daily Chart – Rejected at the 50 SMA Again

Every day there are announcements of shutdowns in heavy industry in Europe with fertilizer, smelters and even glass suffering.
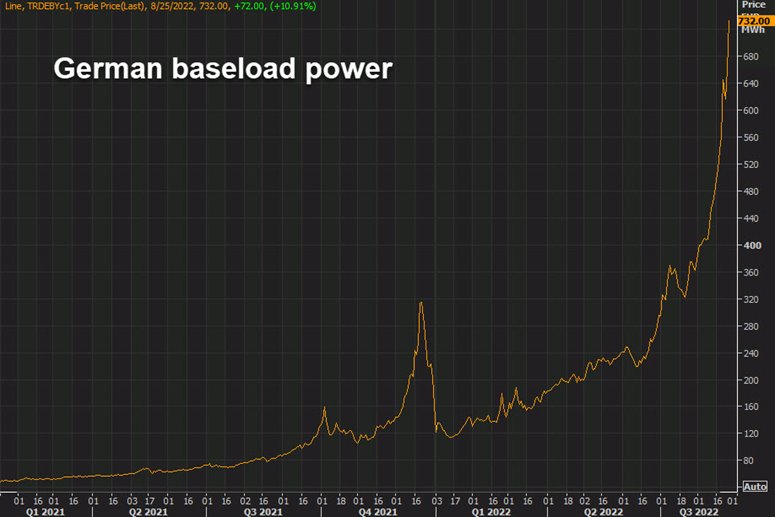
- German 1-year forward power is €732 per MWh
- French 1-year forward power is €870 per MWh
The 2010-2020 average was around €41 per MWh, according to Bloomberg’s Javier Blas.
The charts are parabolic.

TTF gas prices are another 4% higher today.

Germany will be paying out upwards of 8% of GDP for gas at these prices.
What’s scary is that there’s no end in sight. A lot depends on the weather but storage could get to 100% full by October 1. Assuming Russia keeps Nord Stream 1 at 20% and a 15% reduction in demand, that should be enough to get through the winter but then it all starts again next year. And Europe is bidding against Asia and the rest of the world for LNG cargoes. There’s no hope for a meaningful increase in LNG until around 2026.


