Bitcoin Struggles Below $19,600 – Downward Trendline to Drive Downtrend
Bitcoin began an upward retracement from its low of $18,223 versus the US dollar. BTC has risen above $19,000 but is presently seeing
Bitcoin began an upward retracement from its low of $18,223 versus the US dollar. BTC has risen above $19,000 but is presently seeing resistance at the 100 hourly SMA. BITCOIN fell as low as $18,223 before beginning an upward trend.
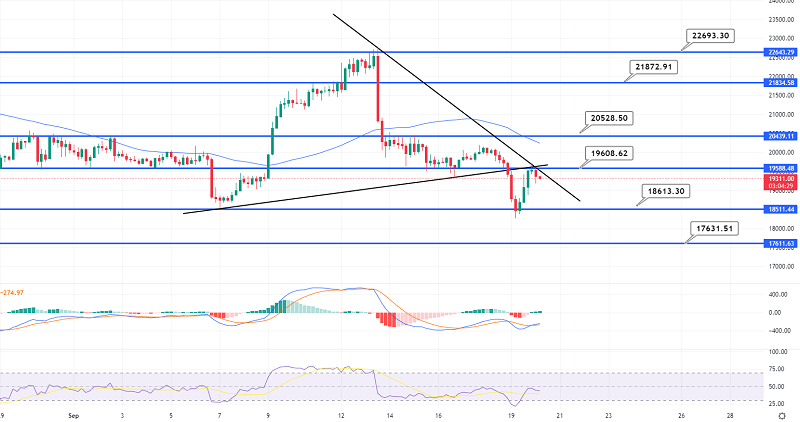
The price remains below $20,000 and the 100 hourly simple moving average. On the hourly chart of the BTC/USD pair, a significant negative trend line is forming with resistance near $19,650. To continue upward towards $20,500, the pair must break over the trend line and the 100 hourly SMA.
Bitcoin Price Reaches $19,000
Bitcoin’s price fell further after settling below $19,000. BTC fell as low as $18,223 after breaking through the $18,500 support zone. There was no test of the $18,000 level, and the price began to rise. Above the $18,500 and $18,800 thresholds, there was consistent growth. The price was able to cross the 50% Fib retracement level of the bearish move from the swing high of $20,198 to the low of $18,223.
Bitcoin’s price even surpassed the $19,500 barrier level. The Bears were aggressive at the $19,600 level and the 100 hourly simple moving average. On the hourly chart of the BTC/USD pair, a significant negative trend line is forming with resistance near $19,650. The trend line is close to the 76.4% Fib retracement level of the decline from the swing high of $20,198 to the low of $18,223.
On the upside, the trend line and the $19,600 mark provide immediate resistance. The next big barrier is located at the $20,000 mark. Any further advances might push the price to the $20,500 barrier level. Furthermore, if the bulls maintain momentum, the price might reach $21,200.
Bitcoin Technical Outlook
If Bitcoin fails to rise above the $19,600 barrier level, it may begin a new drop. On the downside, there is immediate support at $19,200.
The next big support is at $18,850. A decisive break below the $18,850 and $18,800 levels might pave the way for a move to the $18,223 low or perhaps a new low.
- Check out our free forex signals
- Follow the top economic events on FX Leaders economic calendar
- Trade better, discover more Forex Trading Strategies
- Open a FREE Trading Account