Forex Signals Brief for October 03: Heading Into October With High Volatility


Last Week’s Market Wrap
Last week we closed September, which was a volatile month for most markets. The US Dollar was king as it remains the only safe haven left, which benefits during times of distress. One major negative event this month was the surge in UK gilt yields which continued to surge until the Bank of England intervened. They brought yields down to around 4% from 4.60%, calming the markets down and improving the sentiment toward the end of the month, but they still remain quite high.
EUR/USD finally fell below parity and it is feeling comfortable down there now, while inflation kept surging in September, reaching 10%. We also saw an intervention from the Bank of Japan, stabilizing the Yen after a massive decline in the last few months. Stock markets and commodities ended the month lower with the risk sentiment remaining negative overall.
This Week’s Market Expectations
So, September was quite volatile, and October is expected to be volatile as well. The FED and the ECB are expected to raise interest rates by 0.75% in this month’s meetings while maintaining hawkish rhetoric. Today we had the CPI inflation report from Switzerland, which still remains relatively low at around 3.5%, but it’s high enough to keep the SNB hawkish, after two strong rate hikes. The final Europeanmanufacturing numbers for September were released this morning showing that the activity remains in contraction. Later we have the US ISM manufacturing report, which is expected to show a slight slowdown, but remain in expansion.
Forex Signals Update
Due to the immense volatility last month, we had a large number of trading signals, 110 in total, many of which were long-term signals. We got caught on the wrong side during sudden shifts in the sentiment, but the performance was positive overall and in the end closed the month with 70 winning signals and 40 losing ones, giving us a 64/36% win/loss ratio. Our trading signals were in all markets but Gold was out most traded and profitable asset in September.
Remaining Short on [[WTI] Oil in October?
Crude Oil also remained bearish in September as it fell below $80, with moving averages continuing to provide resistance at the up during retraces higher. MAjor central banks are expected to continue raising interest rates sin October, pushing the global economy further into a recession which will be negative for Oil, so we’re thinking about remaining bearish.

WTI Oil – Daily chart
Selling GOLD
Gold continued to remain bearish in September, so we continued to remain bearish in XAU/USD in general, although we also issued buy Gold signals during the retracing periods. We opened 27 Gold signals, accounting for 24% of all our trades, most of which closed in profit.

XAU/USD – Daily chart
Cryptocurrency Update
September was a neutral month for cryptocurrencies, which continued to trade in a range after the bearish reversal in August. Nonetheless, we opened 7 crypto signals, most of them long term. We ended up with four winning crypto signals and three losing ones.
BITCOIN Trading Around $20,000
Bitcoin fell below $19,000 last month, although a support zone formed around $18,500, where we have been buying BTC/USD. At the top, moving averages are acting as resistance so a wedge is forming on the daily chart. We will continue to buy Bitcoin in October at the support zone below $19,000, although we’ll keep an eye on the risk sentiment as well.

BTC/USD – Daily chart
Has ETHEREUM Stabilized?
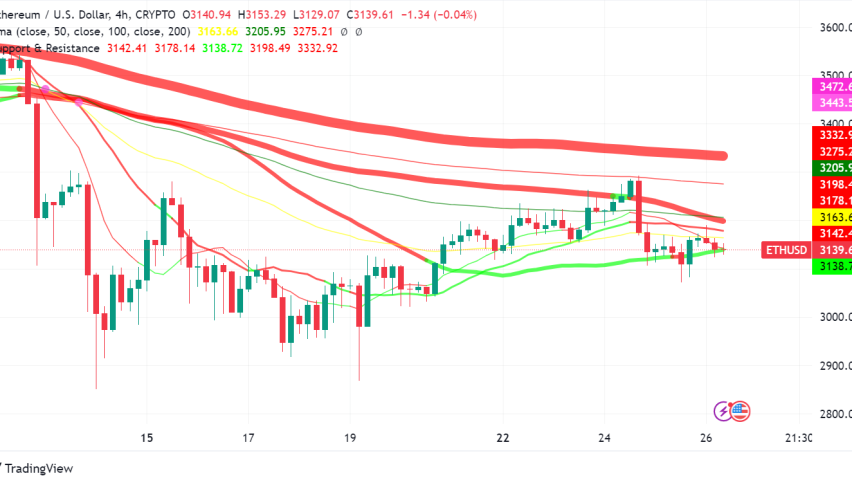
After the launch of the Ethereum Merge in the second week of September, this cryptocurrency turned bearish as the sentiment turned negative in the financial markets, instead of moving higher. The 20 SMA (gray) was acting as resistance during most of last week, showing strong selling pressure, then the 50 SMA (yellow) came into play. But yesterday buyers pushed above these two moving averages again, so let’s see if buyers can hold the price above them today.

ETH/USD – Daily chart