Has the USD Reached A Top?
The USD has been extremely bullish as the only remaining safe haven asset, but we are seeing some bearish signs recently
The US Dollar has been on a really strong trend, particularly since March, as it now remains the only safe haven asset, with Gold and Silver turning into risk assets suddenly. The FED has raised interest rates pretty fast, delivering three 75 bps (basis points) in the last three meetings and planning to do so again in this month’s meeting.
This has been keeping the USD bullish, although the FED has strongly stressed that it will all depend on the economic data. Although, the USD is not benefitting from the positive numbers, while yesterday we saw it tumble lower on negative data. So, the news doesn’t always tell the story, but the market reaction to news does.
In the past two weeks, there have been a series of surprisingly-resilient US economic data reports. Those figures were an alibi for the FED to keep rates high, since the economy could support them. Despite that, the USD didn’t get much of a boost from the numbers. Yesterday, we saw a dive instead, as the ISM manufacturing dived lower.
The ISM manufacturing report came in at 50.9 points against 52.5 expected and there was a relatively big reaction. The USD slumped across the board, including large moves against the commodity currencies on the day and GBP. This sort of reaction shows that USD longs have reached a limit. This is a preview of what we’re likely to see when the FED starts to give dovish signs, as more economic numbers start to show further weakness in the economy.
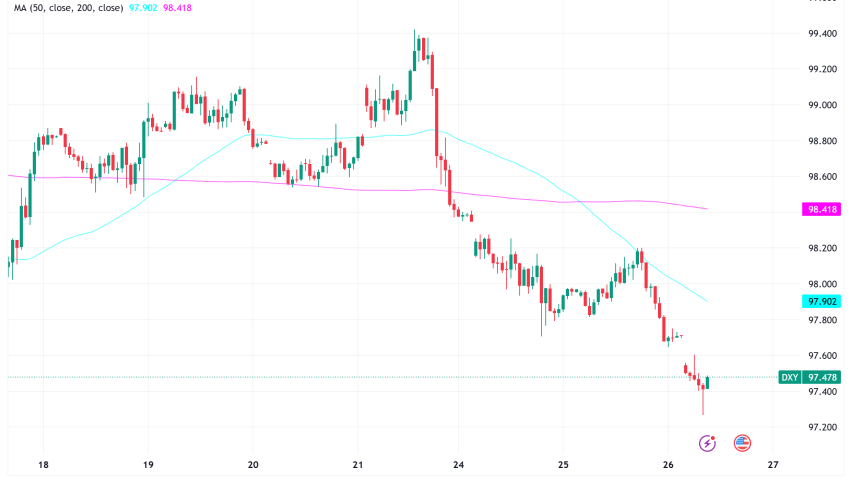
Dollar Index DXY Daily Chart – Trading at the 20 SMA

Will the 20 SMA hold as support?
This means that the USD might have reached a top for now and we will see a pullback from here on, coming in waves. The USSD index DXY has retreated around 3 points lower from the top last week, although it is facing the 20 SMA (gray) on the daily chart. The 50 SMA (yellow) has been the ultimate support, but we’ll see if the 20 SMA holds.
- Check out our free forex signals
- Follow the top economic events on FX Leaders economic calendar
- Trade better, discover more Forex Trading Strategies
- Open a FREE Trading Account