Bitcoin Breaks above $20,000 – Quick Daily Outlook
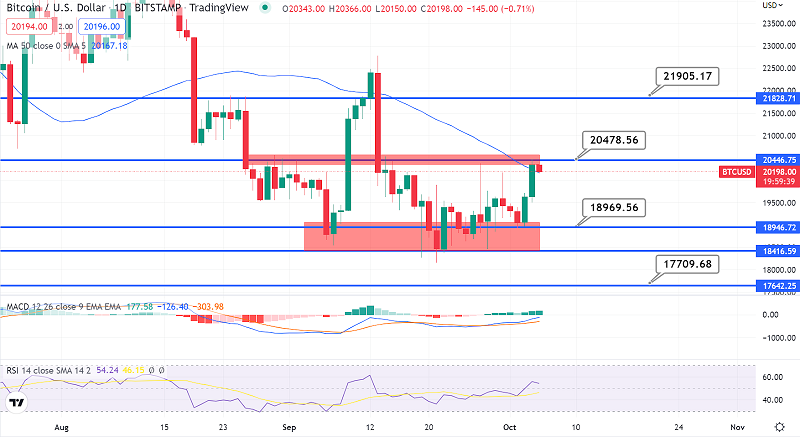
Bitcoin's price is on track to surpass $20,000 versus the US dollar. BTC is exhibiting signs of strength and may soar above $20,500.

Bitcoin’s price is on track to surpass $20,000 versus the US dollar. BTC is exhibiting signs of strength and may soar above $20,500. Bitcoin began to rise steadily just above the $19,200 and $19,500 resistance marks. The price currently trades over $20,000 and the 100 hourly simple moving average.
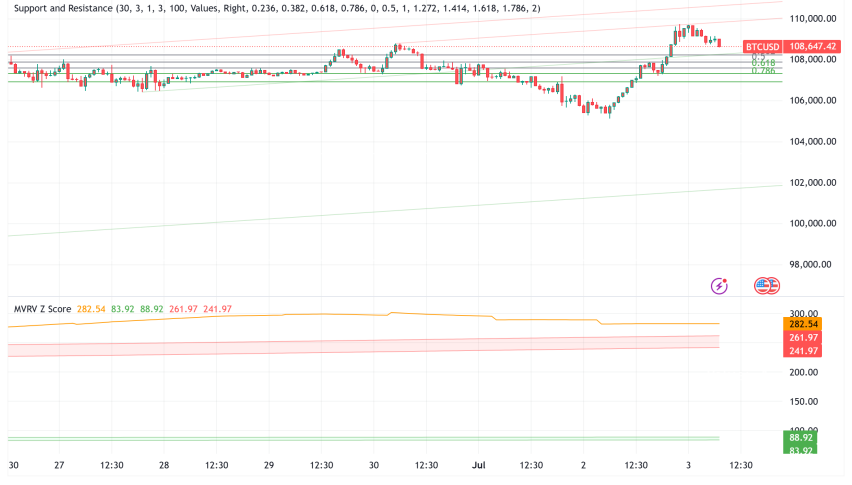
On the hourly chart of the BTC/USD pair, a connecting bullish trend line with support near $20,000 is forming. The pair is gaining momentum and could break through the $20,500 mark. Bitcoin price set a base at $19,000 and began a steady rise. BTC broke through the resistance levels of $19,500 and $19,650.
The bulls successfully pushed the price above the $20,000 resistance level. The price reached a high of $20,475 and is presently reversing gains. BITCOIN currently trades over $20,000 and the 100 hourly simple moving average. Bitcoin is presently gradually falling below $20,400.
It is trading far above the 23.6% Fib retracement level of the upward advance from the swing low of $18,937 to the high of $20,475. On the hourly chart of the BTC/USD pair, a connecting bullish trend line with support near $20,000 is also forming.
On the upside, an immediate resistance level is near $20,450. The next significant resistance level is at $20,500. A decisive break above the $20,500 barrier level could spark another rise. The price could possibly breach the $21,200 resistance level in this scenario. The next major resistance level is around $22,500.
What if BTC Breaks Under $20,000?
If Bitcoin fails to break over the $20,500 barrier level, it may begin a downward trend. On the downside, there is immediate support near the $20,100 level. The next significant support is between the $20,000 level and the trend line. If the price falls below the trend line, it might reach $19,700.
It is close to the 50% Fib retracement level of the upward advance from the swing low of $18,937 to the high of $20,475. The primary support is near $19,500, and the price may fall to $19,200.
- Check out our free forex signals
- Follow the top economic events on FX Leaders economic calendar
- Trade better, discover more Forex Trading Strategies
- Open a FREE Trading Account


