USD/CAD Breaks Above the 50 Daily SMA, As Ivey PMI Slows
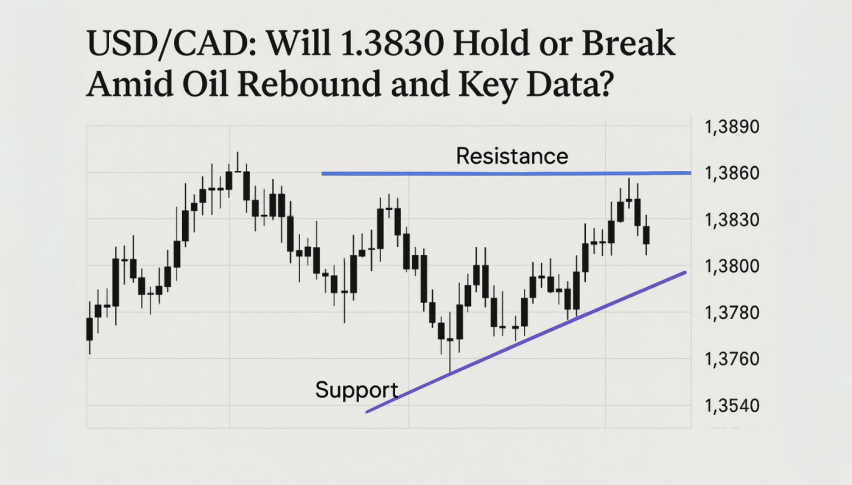
USD/CAD resumes the bullish trend again after last week's pullback lower and today's break above the 50 SMA was a bullish signal

USD/CAD made some massive gains in September as the USD surged higher, but last week we saw a retreat lower, which continued early this week. The price fell below moving averages, and the 50 SMA (yellow) turned into resistance on the H4 chart. After yesterday’s rejection, buyers were testing this moving average again and we decided to open a sell forex signal there.
USD/CAD H4 Chart – The 50 SMA Broke on the 3rd Attempt

Buyers are back in control here
But, buyers kept pushing and eventually, they broke above the 50 SMA. The decisive move came after the Canadian Ivey PMI report for September and the US unemployment claims, which were released a while ago. The Ivey PMI fell to 59.5 points, when it was expected at 62.3 points.
US Weekly Initial Unemployment Claims Report

- Weekly initial jobless claims 219K vs 203K expected
- Prior was 193K (revised to 190K
- Four-week average 206.5 vs 207K prior
- Continuing claims 1361K vs 1345K expected
This is the highest since the final week of August and ends a two-month run of falling numbers. Bad news is good news for markets and stock futures bounced on this. The US dollar also edged lower initially but is back up now, sending USD/CAD above 1.37.
The largest increases in initial claims for the week ending September 24 were in Ohio (+1,586), North Carolina (+289), Tennessee (+286), Arkansas (+38), and Arizona (+35). The largest decreases were in Michigan (-5,715), New York (-1,404), New Jersey (-1,400), Missouri (-966), and Georgia (-799).
USD/CAD Live Chart
- Check out our free forex signals
- Follow the top economic events on FX Leaders economic calendar
- Trade better, discover more Forex Trading Strategies
- Open a FREE Trading Account


