Forex Signals Brief for October 12: US Producer Inflation and FOMC Minutes
Yesterday we saw a risk reversal after BOE comments on bond operations, while today the US PPI inflation and FOMC minutes might get spark vo
Yesterday’s Market Wrap
Yesterday we saw a reversal in the market sentiment during the European session, probably with the UK employment report helping improve risk sentiment. But the tone deteriorated as US markets opened, with tech leading the selloff in equities. The IMF helped it along with a cut to 2023 GDP estimates and a warning on financial stability.
The speech from BOE’s Bailey who slammed the door on extending the gilt purchase operation hurt the sentiment further. That sent cable more than 100 pips lower and sparked a broad US dollar bid. Stock markets tumbled again in the usual risk-off manner. UK gilt yields resumed the uptrend so we’re keeping an eye there as things might get ugly fast.
Today’s Market Expectations
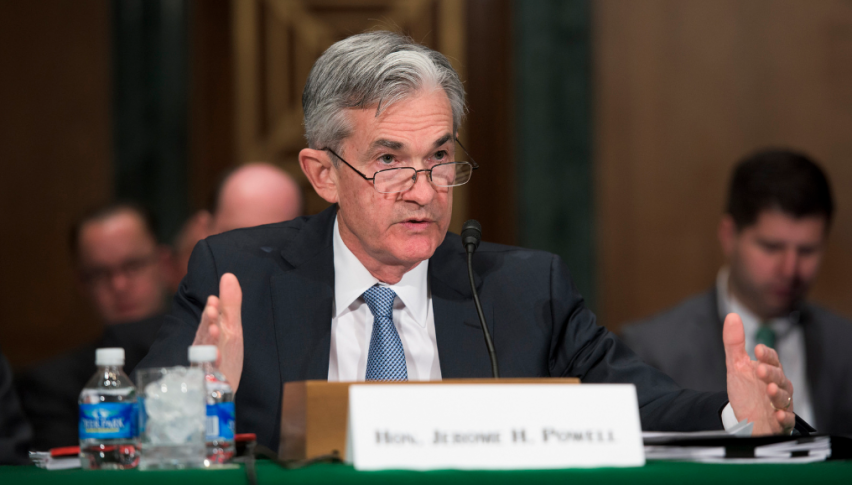
After yesterday’s positive employment report for August, this morning the UK GDP report for the same month was published. Although the bond yields are the driving force for the GBP at the moment. Later we have the US PPI producer inflation report and the FOMC minutes from the last FED meeting, which might get the markets going. Besides that, the G20 meeting is all day so we might get interesting comments from there as well.
Forex Signals Update
Yesterday there were no large moves, but there was volatility and we saw a couple of sudden reverses in the sentiment, which sent the USD up, down, and then up again, we started good with a winning signal, then got caught on the sudden reversal but made up toward the end of the day with some more winning forex signals. We opened seven trading signals three of which reached take profit while four hit stop loss.
Remaining Short on GOLD
EUR/USD turned bearish at parity on Wednesday last week after being bullish for more than a week and declined until yesterday morning. But, by the middle of the day, we saw a sudden jump which caught us on the wrong side, as we decided to sell this pair at the 50 SMS (yellow) on the H1 chart. But the 100 SMA (green) rejected the price so it reversed back down eventually.

EUR/USD – 60 minute chart
Buying USD/JPY
USD/JPY dived lower after the intervention from the Bank of Japan last month but recuperated well, although until last week it was trading sideways. But the bullish momentum resumed again and the 20 SMA (gray) has turned into support on the H1 chart. We decided to open a buy signal yesterday at that moving average, which closed in profit as the upside momentum continued.

USD/JPY – H1 chart
Cryptocurrency Update
Cryptocurrencies have been trading in a range for more than a month, with Bitcoin trading above and below $20,000. Early last week cryptocurrencies turned bullish and BTC increased above that major level, but with the bullish reversal in the USD and the risk sentiment turning negative, crypto coins turned lower again from the top of the range, apart from Ripple, which continues to make gains.
The 20 SMA Remains as Resistance for BITCOIN
Bitcoin has been sliding in recent days, although it continues to trade in a range, mostly below $20,000 but also moving above that level at times as well, with the 200 SMA (purple) acting as resistance at the top. Although wither side has the will to take the price too far away from $20,000. On Wednesday we saw a bullish move and buyers pushed above the 200 SMA which has now turned into support for some time, but it broke that moving average as the USD gained momentum. But, that’s good since we’re looking to buy BTC near the lows above $18,500.

BTC/USD – H4 chart
RIPPLE Testing $0.50 After the Retrace
Ripple has been bullish since the middle of last month, surging above $0.50 last week, as the lawsuit against the SEC saw some developments. The price has retreated, so the bullish momentum coned lower a couple of times, but the 20 SMA (gray) has turned into support, holding the price, while the 200 SMA (purple) turned into resistance for some time. Although last week we saw a breakout of the triangle to the upside so the bullish momentum continues.

XRP/USD – H4 chart
- Check out our free forex signals
- Follow the top economic events on FX Leaders economic calendar
- Trade better, discover more Forex Trading Strategies
- Open a FREE Trading Account
- Read our latest reviews on: Avatrade, Exness, HFM and XM
Related Articles

Sidebar rates
Related Posts
