AUD/USD Testing the 50 Daily SMA As Support After the 150 Pip Retreat, Despite Softer Philly FED Manufacturing


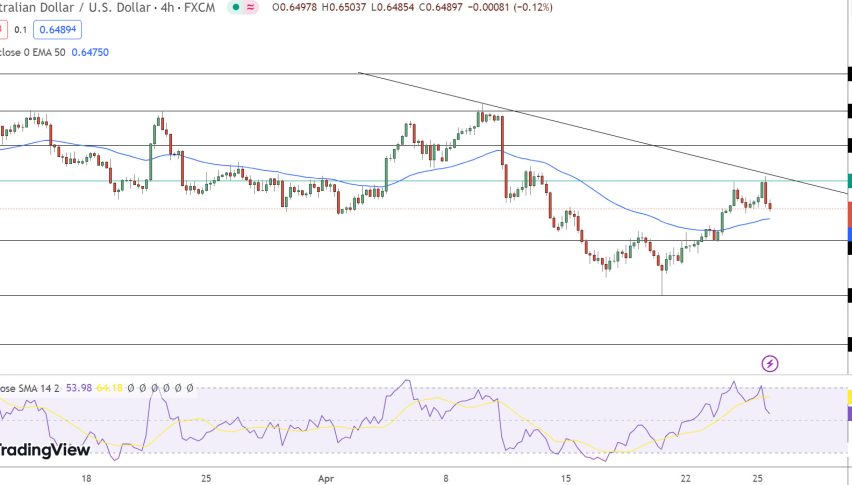
AUD/USD has been bearish for more than a year, falling to 62, as the FED kept raising interest rates pretty fast. But, it started reversing higher about a month ago as the FED started giving dovish signals of slowing down with monetary tightening. This pair climbed to 0.68 earlier this week, but in the last two days it has given back more than 150 pips, as it retreated to 0.6630 earlier today.
The reason for this is the turnaround in the risk sentiment, with the US dollar back on its feet today as Treasury yields increase and stock markets sink. The Australian dollar is taking the hit and it is the G10 laggard as well. AUD/USD is down around 100 pips today to 0.6635 which is the lowest since Friday.
Part of the negativity comes from the increasing covid case counts in China and fresh editorials in state-controlled Chinese media calling for covid-zero. In the larger charts, the short-USD squeeze has run out of juice with yesterday’s strong US retail sales data making the argument that the economy is still running hot.
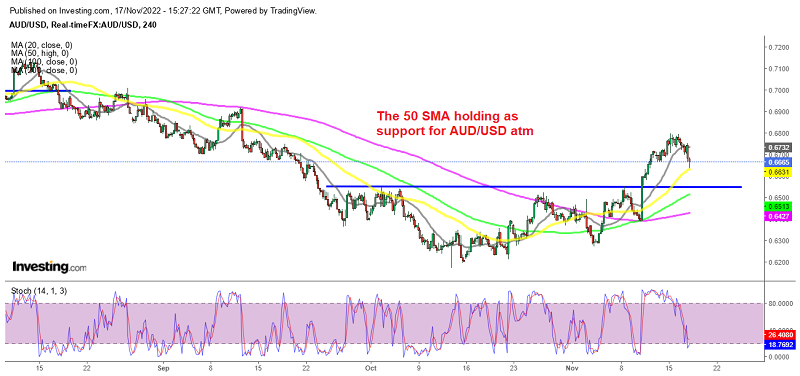
Fed fund futures put the terminal top at 5.00 today, up from 4.87% in the post-CPI period. Bullard’s comments today tilted hawkishly, adding to it. Technically, AUD/USD could go down all the way back to 0.6550 and re-test the minor double top. Although the 50 SMA (yellow) turned into support on the first attempt, holding the decline.
US November Philly FED Manufacturing Index

- November Philly Fed manufacturing -19.4 points vs -6.2 expected
- October manufacturing was -8.7 points
- New orders -16.2 points versus -15.6 prior
- Employment +7.1 points versus +28.5 prior
- Avg workweek +1.4 points vs +10.8 prior
- Capex +6.4 points vs +4.4 prior
- Prices paid +35.3 points versus +36.3 prior
- Future activity -7.1 points vs -14.9 prior
- Delivery times -8.8 points vs -12.6 prior
The trend in this index is clear and surveys like this are forward-looking indicators. Everything points to a much-leaner year in manufacturing in 2023 but the question is: Will the service sector and economy follow?