Forex Signals Brief for December 5: BOC and RBA Slowing Rate Hikes Already


Last Week’s Market Wrap
Last week the USD came after a bank holiday weekend which turned out to be a bearish period for the USD. The first two days the USD tried to come back as markets were worried about the situation in China, which benefited the Buck as a safe haven. But, after Jerome Powell’s speech on the economic outlook, inflation, and the labor market at the Brooking Institution, in Washington DC the risk sentiment improved again and the USD resumed the retreat.
The USD ended the week more than 200 pips lower, as Powell reinstated that the FED will have to slow down, which was repeated by other FED members, as ISM manufacturing fell in contraction during November. There were some positive data such as the JOLTS job openings and the NFP employment report, but they could not revive the USD.
This Week’s Market Expectations
The week started with the OPEC meeting which started yesterday. There were speculations about a 500k barrel increase last week but lat’s see what this meeting will produce. Today we have the service report, with most European service sectors already in contraction so the attention will be on the US ISM services in the afternoon after ISM manufacturing fell in contraction last week.
The Reserve Bank of Australia (RBA) is expected to deliver a 25 basis points (bps) rate hike on Tuesday morning bringing them to 3.10% from 2.85% currently, while on Wednesday the Bank of Canada is expected to deliver a 25 bps hike which will take rates to 4.00%. On Friday we have the Prelim UoM Consumer Sentiment and the US PPI inflation report.
Forex Signals Update
Last week the USD started to fight back but we saw a strong bearish reversal on Wednesday. On Friday we saw another 150 pip jump which also ended in vain and the price ended even lower. So, the volatility was high and there were a few reversals and we had to slow down with trading signals. Although we did open 17 signals in total and closed the week with 11 winning signals and 6 losing ones, with a 65/35% win/loss ratio.
GOLD Continues the Bullish Momentum
Gold has resumed the bullish trend again after turning really bullish early this month, which was followed by range-bound trading in the last two weeks. The price pushed above $1,800 earlier in the week and after a $20 retreat on Friday the price bounced back up which shows relentless buying. We opened several buy Gold signals, most of which closed in profit. 
XAU/USD – 60 minute chart
USD/JPY
USD/JPY continues to display bearish momentum, after the reversal following the jump on Friday. This forex pair turned really bearish after the intervention from the Bank of Japan. We have turned bearish on USD/JPY and will continue to sell retraces higher like we did late last week.

USD/JPY – 60 minute chart
Cryptocurrency Update
Cryptocurrencies were trading in a range for several days until Jerome Powell’s speech, which improved the risk sentiment in financial markets, and digital currencies benefited as well. This shows that they are starting to behave like risk assets again, so the shock from the FTX collapse seems to be over.
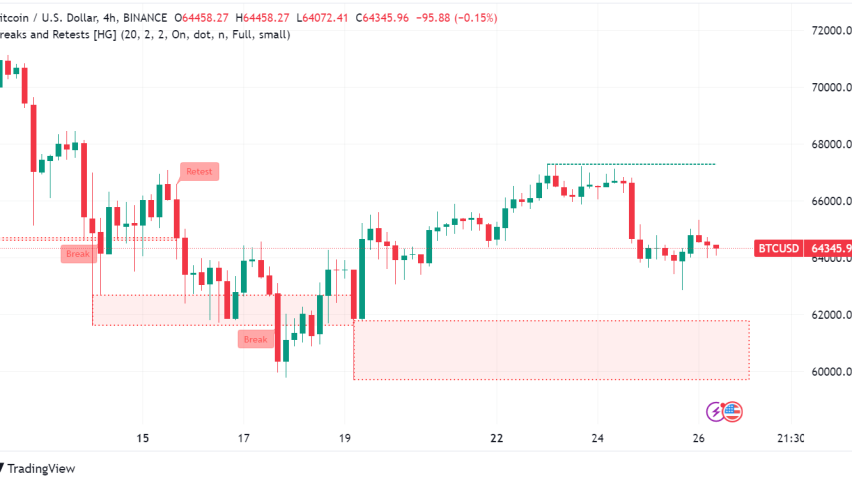
The 20 SMA Turns Into Support for BITCOIN
The decline in Bitcoin seems to have stopped too, as it has started to form a bullish trend after bouncing from the support zone it formed at around $15,500. The price has moved above the 20 SMA (gray) on the H4 chart which has been acting as support now after holding early last week and on Wednesday evening we saw a jump, which has taken the price up to $17,000.

BTC/USD – H4 chart
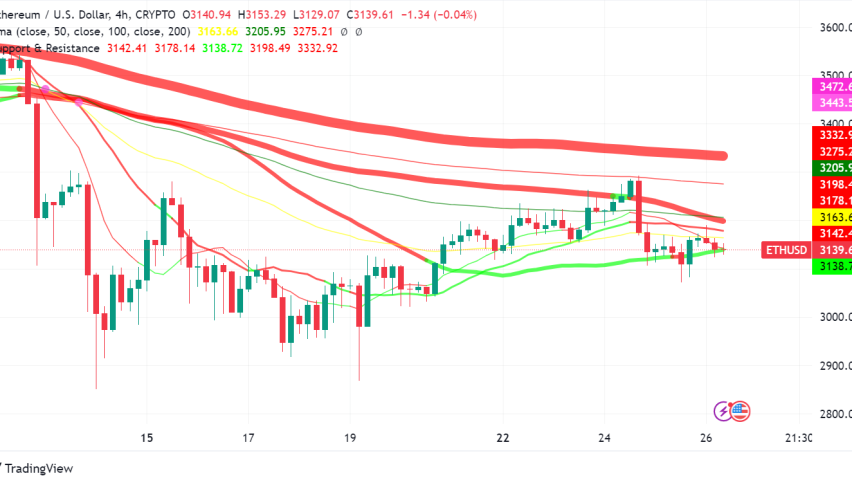
LITECOIN Trying to Overcome the 50 SMA
Litecoin has been making gains since June and the FTX event which sent the crypto market through another crash didn’t affect LTC too much. In the last several weeks we have seen some bullish momentum which has pushed the price above the 20 SMA (gray). This moving average has turned into support now while the 50 SMA (yellow) has turned into resistance and buyers are trying to push LTC above it.