Is the Bearish Reversing Pattern in USD/CAD Failing As Oil Turns Lower?
USD/CAD formed a bearish reversing pattern at the 50 SMA and started declining, but sellers are getting weaker

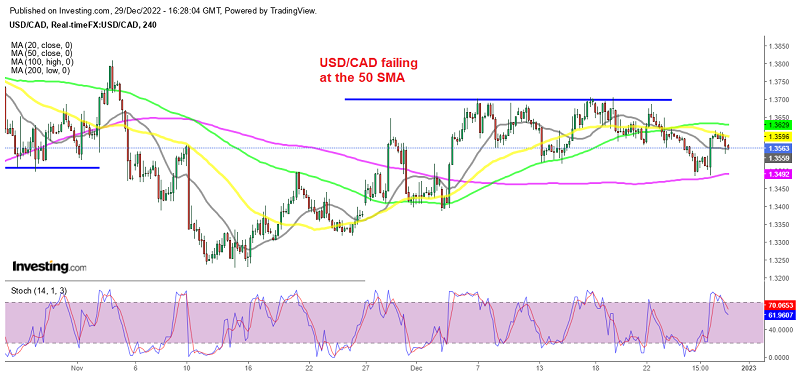
[[USD/CAD]] turned bullish by the middle of November as the USD was still declining, showing that the Canadian Dollar has been under pressure and this pair climbed around 450 pips until early this month. But a resistance formed around $1.37, which buyers have been finding hard to push the price above.
Last week we saw a reversal and a retreat lower below 1.35 as crude Oil turned bullish, pulling the CAD higher with it. But, the 200 SMA (purple) held as support on the H4 chart and we saw a bounce higher yesterday, pushing the price above 1.36. The $4 decline in crude Oil prices after the drawdown in the private API crude inventories helped fuel the bullish moe, apart from some sudden USD buying.
But today the USD has turned bearish, while Oil prices increased around $1.60 during the European session, with the US WTI crude reaching up to $78.40 from session lows at $76.80. Although, crude Oil has reversed back down now, giving back the gains in the US session.
A while ago we saw US initial unemployment claims increase by 9K amounting to 225K in the week of December 24, with the 4-week moving average declining by 250 to 221,000 from the previous week. Although in the last hour or so, this pair pulled back up and is trading 30 pips higher, after the rejection by the 50 SMA (yellow) on the H4 chart. so, the bearish reversing pattern is not looking as strong now and the USD is starting to gain some ground.
US Weekly Initial Jobless Claims
- Weekly initial jobless claims 225K vs 225K expected
- Previous weekly claims were 216K
- Continuing claims 1,710K vs 1,686K expected
- Prior continuing claims 1672K
Jobless claims are highly volatile at Christmas and New Year because of holiday skews. You don’t get a clean read until the second week of January. For 2023, the Fed will want to get claims to around 300k, so there is plenty of ground to cover.
USD/CAD Live Chart
- Check out our free forex signals
- Follow the top economic events on FX Leaders economic calendar
- Trade better, discover more Forex Trading Strategies
- Open a FREE Trading Account


