EUR/USD and Gold Testing the 50 MA As Support, After the Retreat on US Q4 GDP
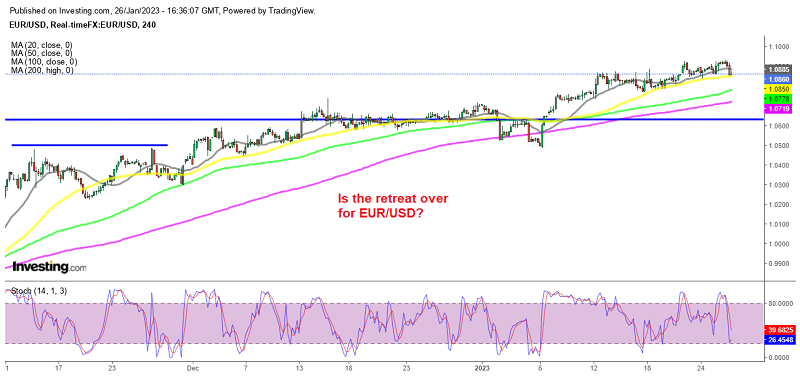
EUR/USD has been very bullish since October, apart from December when we saw a slight retreat, as buyers recharged. The bullish momentum resumed again this month and buyers pushed EUR/USD above 1.09, but they haven’t been above to push above 1.0930. The price retreated lower today after the GDP report, but the 50 SMA continues to hold as support on the H4 chart we opened a buy EUR/USD signal.
The GDP report showed that growth slowed slightly in Q4 from Q3, but was better than consensus. So we saw a jump in the USD, although a large part of that came from government spending and inventories building up. Inflation numbers in the GDP report ahead of tomorrow’s PCE inflation report indicated that it might be soft, so I think that the USD selling might resume. The advance trade report was also soft.
US Q4 2022 Advance GDP Report

- Q4 advance GDP +2.9% vs +2.6% expected
- Final Q3 reading was +3.2% annualized
- Q2 was -0.6% annualized
Details:
- Consumer spending +2.1% vs +2.3% prior
- Consumer spending on durables +0.5% vs -0.8% prior
- GDP final sales +1.4% vs +4.5% prior
- GDP deflator +3.5% vs +3.3% expected
- Core PCE +3.9% vs +4.0% expected
- Exports -1.3% vs +14.6% prior
- Imports -4.6% vs +-7.3% prior
- Net trade added 0.56 pp to GDP vs adding 2.86 pp in Q3
- Inventories added 1.46 pp vs a cut of 1.19 pp in Q3
- Govt added 0.64 pp vs +0.65 pp in Q3
The final Atlanta Fed GDPNow estimate for Q4 was +3.5%. This looks like a good report but I’m increasingly worried about falling imports. Some of that is lower commodity prices but it also speaks to softer forward demand.
Gold H4 Chart – The Price Dipped Below the 50 SMA

Can the 50 SMA hold as support again for Gold?
Gold has been extremely bullish as uncertainty remains high and yesterday it almost reached $1,950, but retreated lower and the US GDP figures sent it below the 50 SMA. Although, buyers came back pretty fast and pushed the price above it, so the 50 SMA remains as support on the H4 chart and we decided to open a buy Gold signal at this moving average.
Gold XAU Live Chart
Gold


