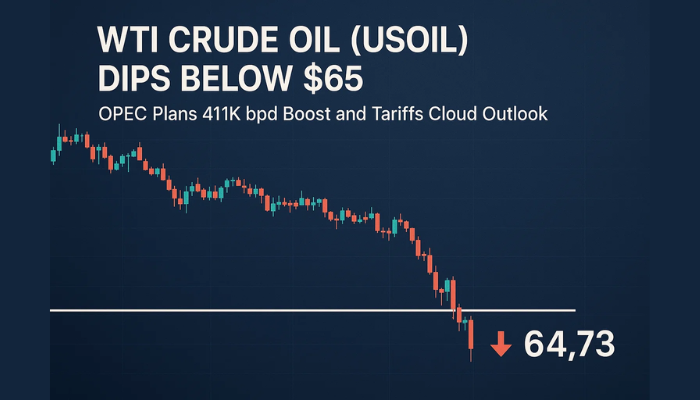
Will WTI Oil Break Below $70 This Time?
The selling pressure has returned in crude Oil as risk sentiment turns negative and the USD gains some momentum

Crude Oil was displaying some bullish momentum during most of January, as risk sentiment improved while the USD resumed the decline. Although we saw a reversal in the last week of last month as the reopening in China didn’t impress the stock market there. The fear as we headed into the FED and ECB meetings also played a part in the reversal, after the 100 SMA (green) had been providing resistance on the H1 chart.
The decline eventually picked up pace and on Friday last week we saw a strong bearish move, as the USD surged higher, after some great employment and services numbers fror January. Taking a look at the weekly chart, the price of WTI Oil has been moving up and down since November when it placed a low above $70.
US Oil Weekly Chart – The Bearish Trend Has Resumed

Oil is already oversold, but the decline is picking up
Since then, Oil has been finding resistance near the 50% of the move up from November 2020 low near $82.50s and support near the 61.8% of the same move above $70 with the print low at $70.08. The 100 weekly SMA at around $83.36 is also a strong resistance indicator since it was broken in November after it had been acting as support before.
friday was brutak for Oil, with hugevolatility. The high price reached $78.00 while the low came at $73.13 which was the lowest level since January 23. The low for the year reached $72.46 back on January 5th with the cycle low from December at $70.08. The 200 SMA (gray) has been the ultimate though, since early November, having rejected the price twice already and pushing the highs lower.
Now, WTI Oil is heading for the support zone above $70 again, so we’ll see if sellers have enough power to push the price below important zone We remain bearish on Oil, and will try to sell retraces higher on smaller timeframe charts.
US WTI Crude Oil Live Chart
- Check out our free forex signals
- Follow the top economic events on FX Leaders economic calendar
- Trade better, discover more Forex Trading Strategies
- Open a FREE Trading Account


