USD/CHF Showing Signs of Bearish Continuation
Today we saw an increase in Swiss inflation, but USD/CHF is showing increasingly bullish signals as it pushes above MAs
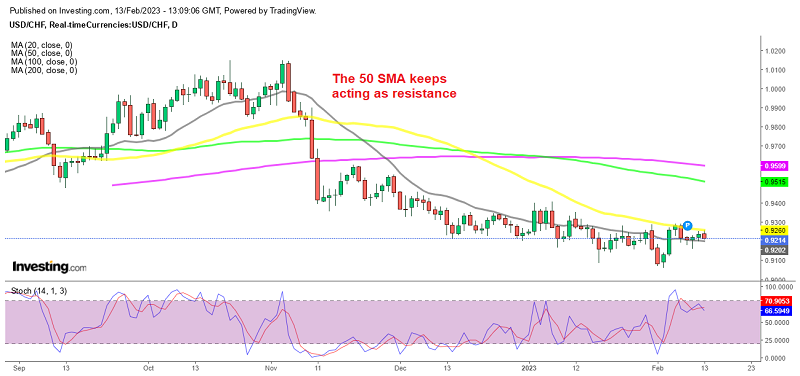
USD/CHF made a sharp bearish reversal in November after being bullish since the beginning of 2022 and lost around 8 cents in a few days. Moving averages turned into resistance, with the 20 SMA (gray) pushing the highs lower when the pace of the decline was really strong late last year, then as the pace slowed down, the 50 SMA (yellow) took over so far this year.
But, now we are seeing signs of a bullish reversal, which started with the slowdown of the downtrend, followed by the break of the 20 SMA on the daily chart. Now, USD/CHF buyers are looking at the 50 SMA and if this moving average gets broken, then the shift will be official.
Today we had the inflation report from Switzerland, which showed an increase in January, picking up after the cool-off we saw in the last months of 2022. But, the Swiss National Bank (SNB) is not really basing the monetary policy on inflation, but rather following the ECB, so today’s inflation numbers didn’t help the CHF much.
Swiss January CPI Inflation Report
- January CPI MoM +3.3% vs +2.9% expected
- December CPI MoM was +2.8%
- CPI MoM +0.6% vs +0.4% expected
- December CPI MoM -0.2%
That is quite the beat on estimates, with annual core inflation also seen rising further in January to 2.2% – up from the 2.0% reading in December. That will keep the SNB on its tightening path with little change seen to the overall policy stance for now.
USD/CHF Live Chart
- Check out our free forex signals
- Follow the top economic events on FX Leaders economic calendar
- Trade better, discover more Forex Trading Strategies
- Open a FREE Trading Account