Going Long on USD/JPY As US Inflation Holds
Inflation posted a slight decline but came a bit hotter than expected in the US for January, which is keeping traders confused
Traders were all focused on the US inflation report which was released a while ago. Numbers leaned slightly on the strong side but traders are having difficulty digesting the January CPI numbers, with the USD swinging up and down with the question in mind if the FED will hike rates further.
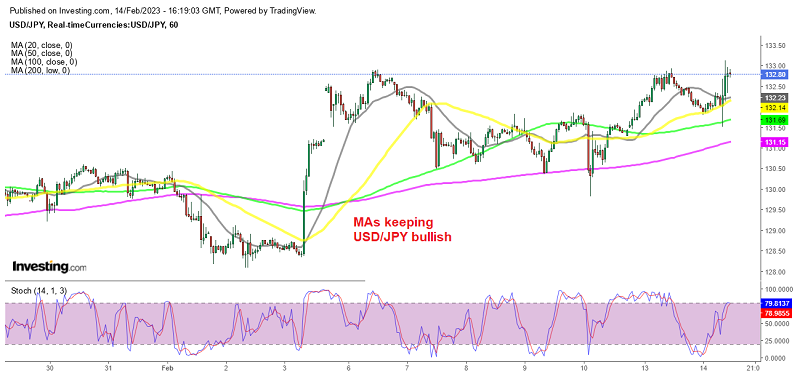
Headline inflation was a tad hot but core inflation was in line; there remain reasons to expect continued cooling for the remainder of the year but will it be enough? Or will inflation pick up again as the economy re-accelerates? USD/JPY has been on an uptrend since early this month and we just closed a buy forex signal in profit after buying the dip lower earlier. Now we are looking for another dip, since the JPY has turned bearish now, which is keeping this pair bullish. Below is the inflation report for January:
Highlights of the US January 2023 CPI Report
- January CPI YoY +6.4% vs +6.2% expected
- December CPI YoY was +6.5%
- CPI MoM 0.4% vs +0.0% expected
- Prior CPI MoM reading was +0.1% (it was revised in the benchmark revisions from -0.1%)
- Real weekly earnings +0.7% vs +0.1% prior (revised to 0.0%)
Core inflation:
- Core CPI YoY ex. food and energy +5.6% vs +5.5% expected
- Prior core CPI was +5.7%
- Core CPI MoM January +0.4% vs +0.4% expected
- December core CPI MoM +0.4%
This is on the hot side but not a complete shock with some economists flagging upside risks. The kneejerk reaction was risk-off and US dollar strength but that didn’t even last a minute and then revered. It looks as though all the talk of a hot number had everyone leaning in the same direction. Used cars fell 1.9% while new vehicles rose 0.2%. Shelter and medical care both rose 0.7% m/m and transportation services rose 0.9%. Food rose 0.5% and energy climbed 2.0% with natural gas as a big boost, up 6.7%.
Housing has flattened out and rent is declining while gasoline prices are steady and natural gas has cratered. So there’s disinflation in the pipeline. Will that be enough to get inflation back to 2% or will it get stuck at 3-4%? One warning sign is the 0.7% m/m rise in real weekly earnings, it could keep spending high.
Here is a good chart from John Authers showing that goods inflation is now back below 2% but services inflation continues to accelerate. Some of that is the lag from housing and will come out, but will it be enough? And will goods inflation stay low?

USD/JPY Live Chart
- Check out our free forex signals
- Follow the top economic events on FX Leaders economic calendar
- Trade better, discover more Forex Trading Strategies
- Open a FREE Trading Account
- Read our latest reviews on: Avatrade, Exness, HFM and XM
Related Articles
Sidebar rates
Related Posts
