EUR/USD Looking Weaker After This Week’s US Hot Data
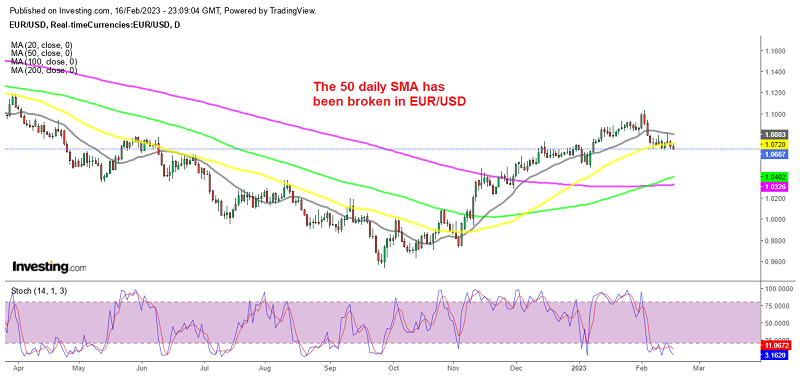
EUR/USD remains bearish and the trend reversal looks more real after the break of the 50 daily SMA this week

EUR/USD was in a strong uptrend until a last higher top formed at 1.10329 on 2 February, as shown on the daily timeframe char above, with the 20 SMA (gray) acting as support, which shows that the pace of the bullish momentum was quite strong.
The price moved above 1.10, reaching a high of 1.10329, but buyers couldn’t hold the price there for too long and we saw a sharp reversal in the following few days. It’s true that the reversal came after the stromng US employment and ISM services numbers for January, but the break of the 20 SMA should have alerted technical traders that the bullish momentum was fading.
So, this pair has pulled back from its impressive advance in the last two weeks although the real test of the pullback came at the 50 daily SMA (yellow), which held the decline innitially. We saw a bounce off that moving average, but the 20 SMA turned into resistance eventually this week, which was another bearish signal.
Now, the 50 SMA has been broken after two strong reports from the US in the last two days, the US retail sales and producer inflation PPI (producer price index) numbers. Those figures also hiked the Atlanta FED GDPNow estimate for Q1, so the USD reversal should continue and this pair should continue lower. We have shifted to shorts as well, and are selling retraces higher.

The Atlanta Fed GDPNow tracker moved up to 2.4% from 2.1% last.
In their own words:
“The GDPNow model estimate for real GDP growth (seasonally adjusted annual rate) in the first quarter of 2023 is 2.4 percent on February 15, up from 2.2 percent on February 8. After recent releases from the US Department of the Treasury’s Bureau of the Fiscal Service, the US Bureau of Labor Statistics, the US Census Bureau, and the Federal Reserve Board of Governors, an increase in the nowcast of first-quarter real personal consumption expenditures growth from 3.0 percent to 3.6 percent was slightly offset by a decrease in first-quarter real gross private domestic investment growth from -5.6 percent to -6.5 percent.”
The details of the models moving higher off the retail sales and industrial production is below. The PCE moved up from 3.0 to 3.6 being a big contributor to the rise.

EUR/USD Live Chart
- Check out our free forex signals
- Follow the top economic events on FX Leaders economic calendar
- Trade better, discover more Forex Trading Strategies
- Open a FREE Trading Account


