More Upside Momentum Expected in USD/JPY After the Bullish Reversal
USD/JPY is looking increasingly bullish after the bullish reversal pattern in January
USD/JPY continues to make large moves, after surging around 40 cents from January to October last year and then reversing after the intervention from Japanese officials, which sent this pair around 25 cents lower, to 127.20s. The surge came as the FED was going through the fastest tightening pace on record, while the Bank of Japan was remaining on hold. Then the BOJ made a move, while the FED started to slow down, which sent this pair lower.
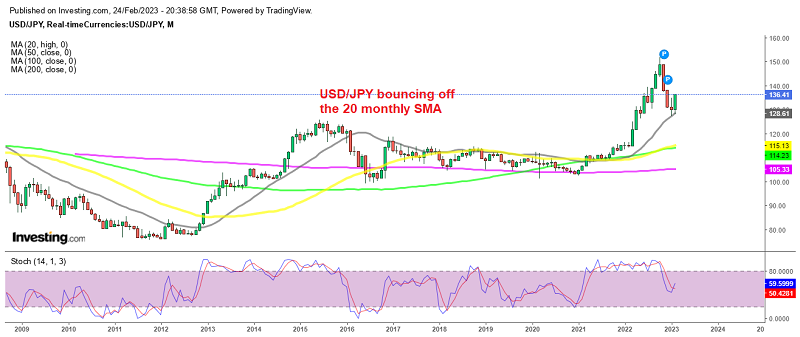
USD/JPY retreated lower and on the monthly chart, we can see two big bearish candlesticks in November and December last year. But, the decline stopped as soon as the price reached the 20 monthly SMA (gray), which held as support and this pair formed a doji candlestick.
That’s a strong bullish reversing signal after the retreat and February’s candlestick looks pretty bullish. So, the situation is shifting again since early this month. The BOJ is still holding on while the FED rhetoric is turning hawkish as the US economy starts to bounce. Inflation is also showing signs that the slowdown might have stalled, although it still remains quite high. In fact, we might see another pick up, as the PCE core price index jumped to 4.7% from 4.4% in January while the previous month was also revised higher to 4.6%. Consumer sentiment is improving on the other hand, which is a strong sign that the economy will continue improving.
UMich Consumer Sentiment for February 2023

- February sentiment 67.0 points versus 64.9 last month (66.4 preliminary)
- January sentiment was 64.9 points
- Preliminary 66.4 points
- University of Michigan consumer sentiment 67.0 points versus 66.4 expectations
- Current conditions 70.7 points versus 68.4 last month and 72.6 points preliminary
- Expectations 64.7 points versus 62.7 v last month and 62.3 points preliminary
- One year inflation expectations 4.1% versus 4.2% preliminary and 3.9% last month
- Five year inflation expectations at 2.9% versus 2.9% last month (and preliminary)
USD/JPY Weekly Chart – Buyers Facing the 20 SMA

The trend will be officially bullish when the 20 SMA is broken
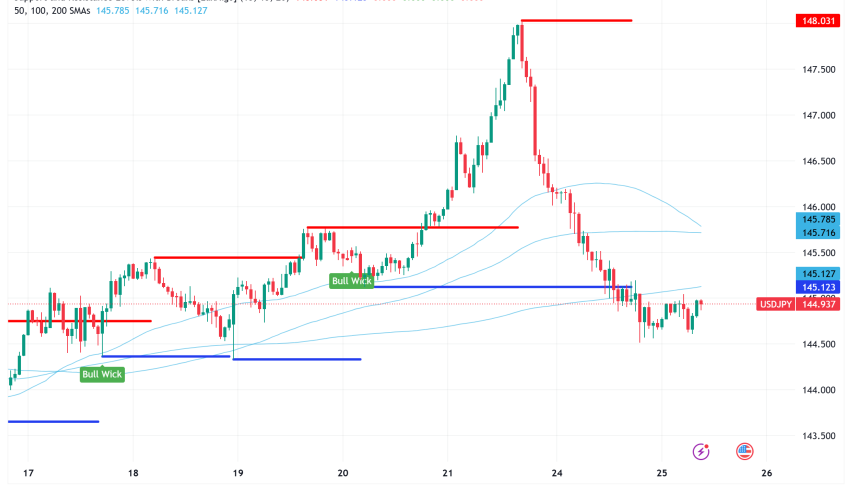
On the weekly chart above USD/JPY is breaking to the upside helped by the core PCE push higher. This pair was oversold as the stochastic indicator shows, but it has been reversing higher since January. Although, buyers still have to push the price above the 20 weekly SMA for the trend to be officially considered bullish, since this moving average used to act as support before.
USD/JPY Live Chart
- Check out our free forex signals
- Follow the top economic events on FX Leaders economic calendar
- Trade better, discover more Forex Trading Strategies
- Open a FREE Trading Account