Looking to Sell GBP/USD As Construction Remains in Contraction in the UK
GBP/USD is facing the 100 SMA on the H4 chart, which is acting as resistance, while construction activity remains in contraction
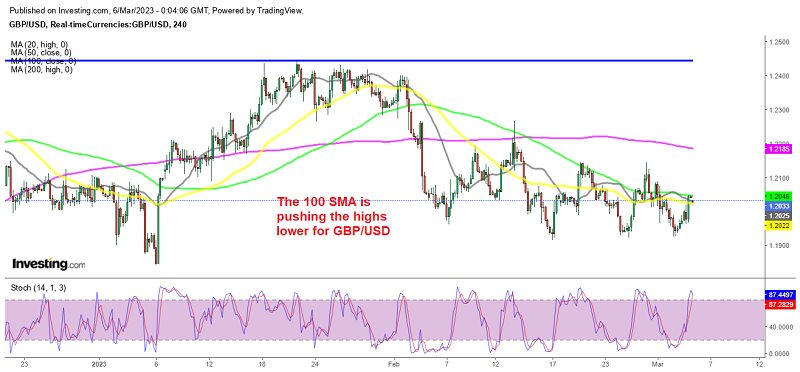
The GBP/USD exchange rate had a volatile week of trading, with the currency pair ending the week near the 1.204os level. Throughout the week, there were fluctuations in the exchange rate, and it tested the low zone above 1.19. However, on Tuesday, this forex pair briefly reached a high of 1.2140s before retracing. Overall, this pair finished the week in the middle of its five-day range, indicating uncertainty and potential for further volatility in the days ahead.
Early last week, this pair was finding some demand on Improving risk mood which came from positive economic data from China. That weakened the demand for the USD while the Conference Board consumer confidence softened in February, which also weighed the USD down.
As a result, the GBP/USD currency pair rose towards 1.20.50 on Friday where it closed the week, with some late Friday bids coming in, as the USD retreated lower again. However, GBP/USD faced the 100 SMA (green) on the H4 chart, which ight bring back the selling pressure, causing it to decline once again.
So, we are watching the price action on this pair to see if the 100 SMA holds and we might open a sell GBP/USD signal from here. The UK construction report for February was released a while ago, showing a slight improvement, but it remains in negative territory (below 50 points) which shows contraction.
UK February Construction PMI Report
GBP/USD Live Chart
- Check out our free forex signals
- Follow the top economic events on FX Leaders economic calendar
- Trade better, discover more Forex Trading Strategies
- Open a FREE Trading Account
- Read our latest reviews on: Avatrade, Exness, HFM and XM
Related Articles


Sidebar rates
Related Posts
