EUR/USD Remains Lethargic Despite Doji Candlestick, Traders Confused by Technical Signals
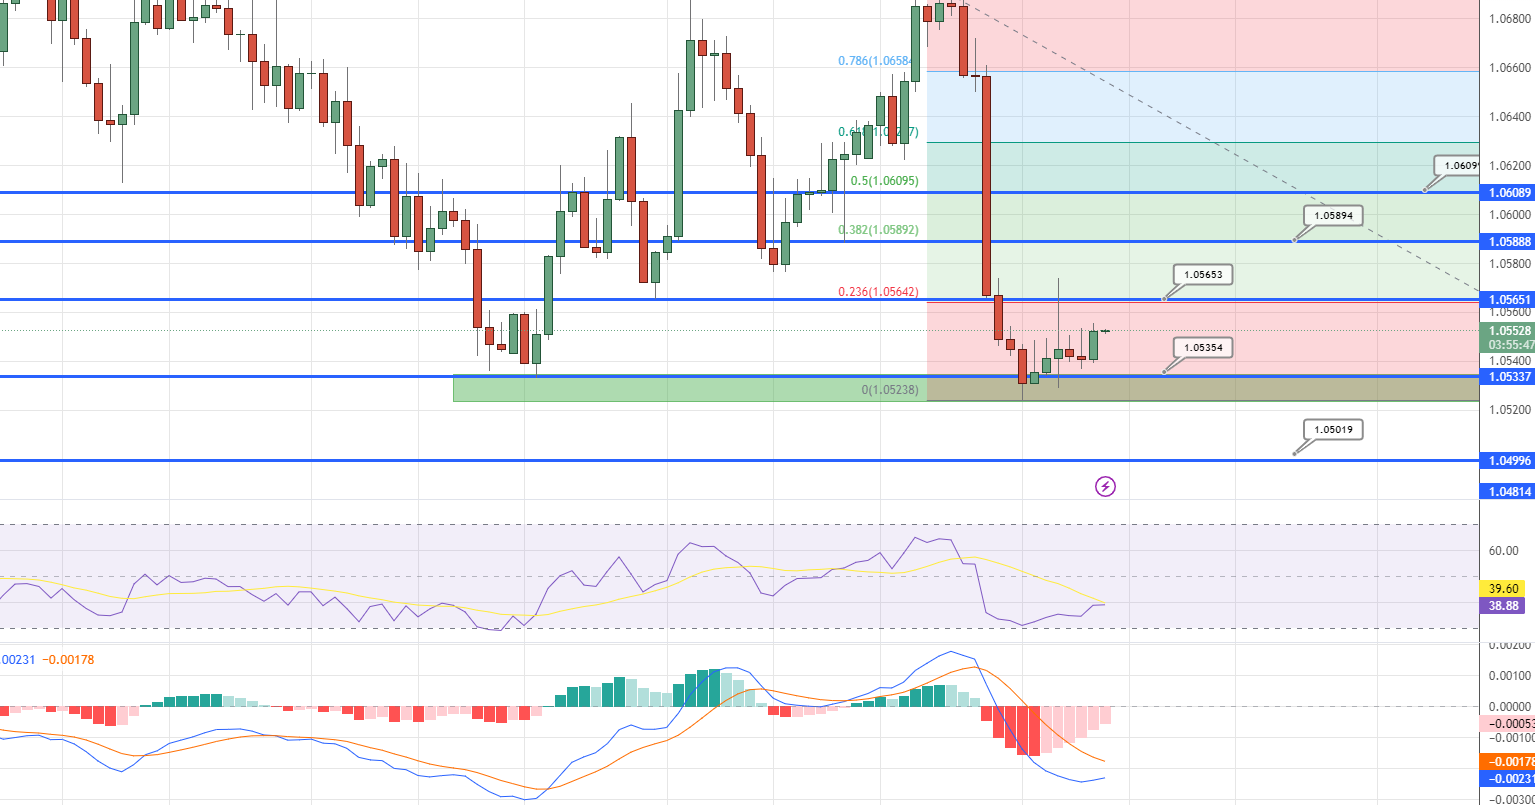
On Thursday, the EUR/USD remained around 1.0550 despite fading the recovery from its lowest level since January.

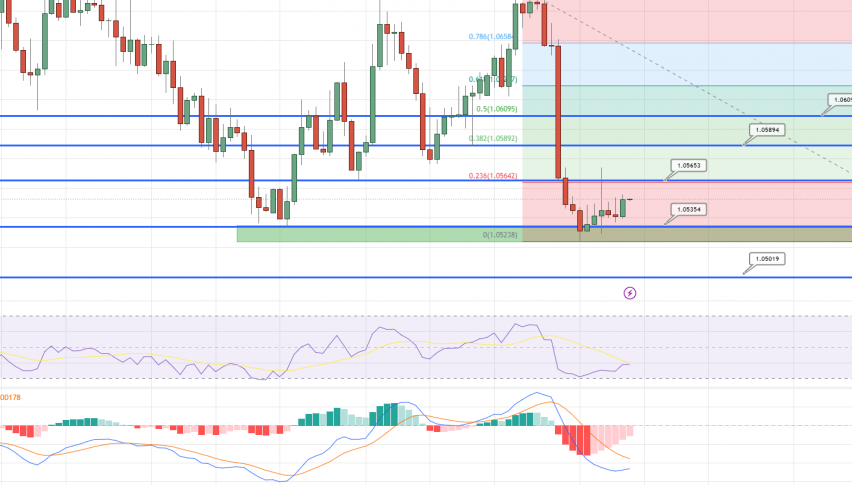
On Thursday, the EUR/USD remained around 1.0550 despite fading the recovery from its lowest level since January 2023. Traders need clarification on technical data. The pair hit a new two-month low on Wednesday, falling to 1.0524 before recovering. However, the day ended with small movements, forming a Doji candlestick, which suggests a corrective bounce in the market.
Although MACD and RSI signals are sluggish, the presence of the Doji just above the 100-DMA keeps EUR/USD buyers optimistic.
If the pair falls below the immediate 100-day moving average support at 1.0525, bears may face resistance from the 2022 lows near 1.0480 and early December lows near 1.0440. The 200-day moving average support at 1.0325 serves as a downward filter.

On the other hand, a daily close above the prior support line from December 7, 2022, at 1.0570, is necessary for the conviction of EUR/USD buyers.
There are more filters to the north, such as the weekly high around 1.0700 and the top around 1.0800 in the middle of February. While a short-term corrective rally in EUR/USD is expected, the prevailing trend is still predicted to be bearish.
- Check out our free forex signals
- Follow the top economic events on FX Leaders economic calendar
- Trade better, discover more Forex Trading Strategies
- Open a FREE Trading Account


