EUR/GBP Dips to 0.8795 Amid Three-Day Decline; Bearish Chart Formation Emerges
The EUR/GBP currency pair experienced a drop to 0.8795 early on Monday, marking a three-day decline as the week began slowly.
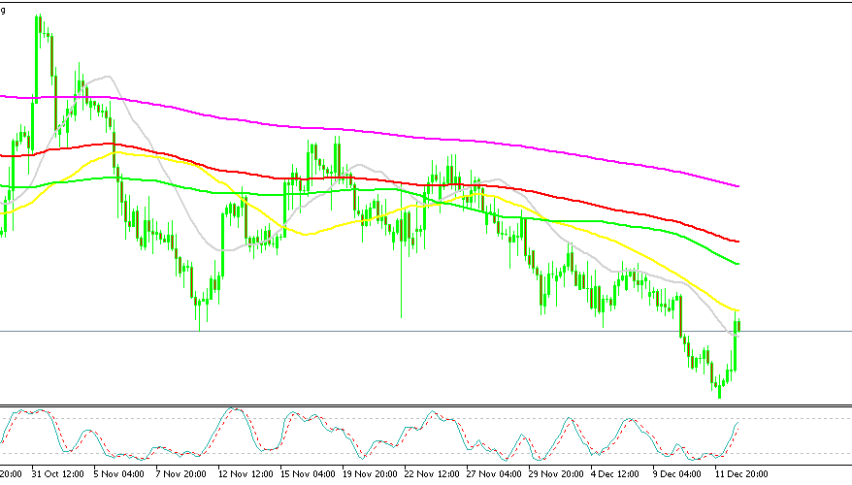
The EUR/GBP currency pair experienced a drop to 0.8795 early on Monday, marking a three-day decline as the week began slowly. The pair continues to trade below the 100-Hour Moving Average (HMA), with negative MACD and RSI indicators supporting the downtrend.
It is important to note that the EUR/GBP pair displays a bearish head and shoulders chart pattern on an hourly basis, given the mentioned negative oscillators and persistent trading below the 100-HMA, which favors sellers.
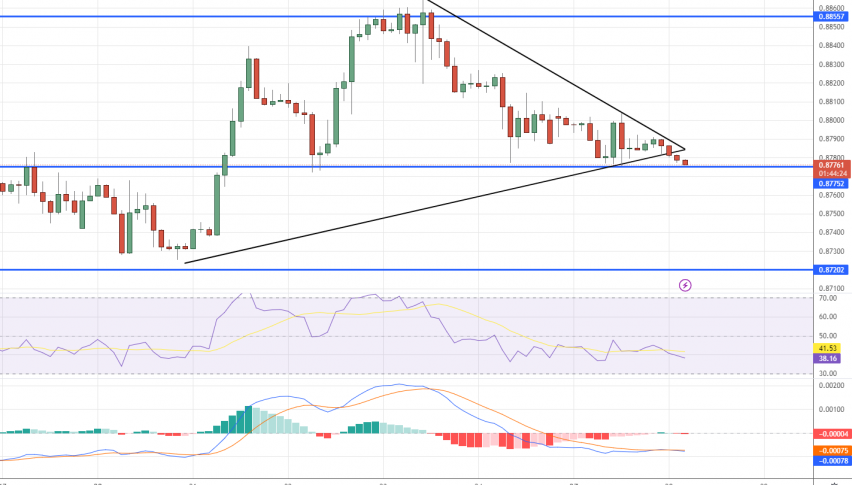
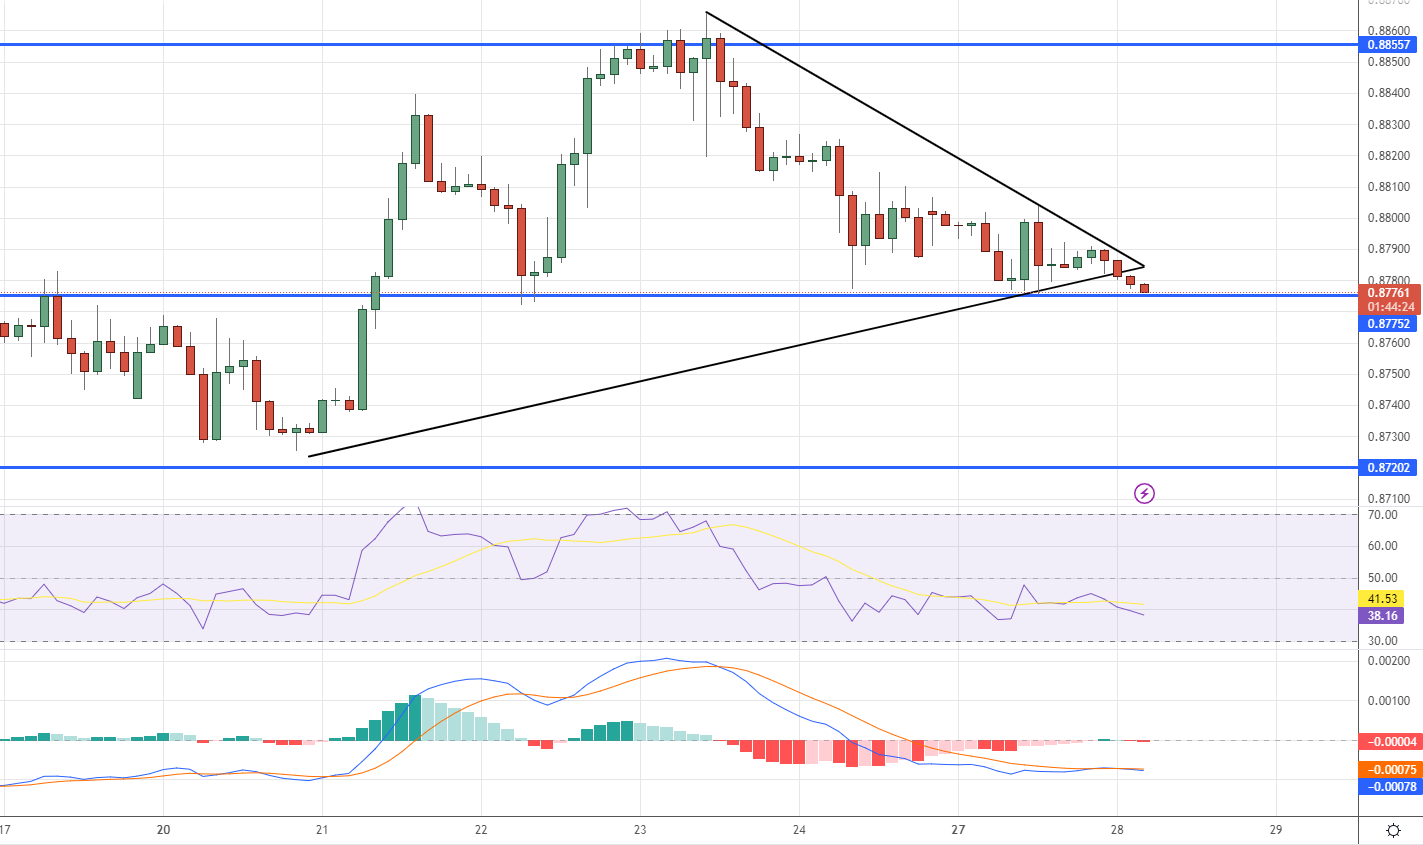
For further declines in the pair’s value, a decisive break of the mentioned neckline of the bearish chart pattern at around 0.8775 is crucial.
Should this occur, an upward support line from March 15 near 0.8745 might serve as a temporary stop during the potential fall towards the target of 0.8670. The monthly low of approximately 0.8715 also acts as a buffer against further declines.
On the other hand, a rebound requires successful trading above the 100-HMA level of 0.8810 to attract EUR/GBP buyers.
However, recent peaks around 0.8865 and the significant 0.8900 level could pose challenges for those looking to purchase the pair.
In the event that the EUR/GBP remains strong beyond 0.8900, the monthly high close to 0.8925 could be the final obstacle for the bears
- Check out our free forex signals
- Follow the top economic events on FX Leaders economic calendar
- Trade better, discover more Forex Trading Strategies
- Open a FREE Trading Account