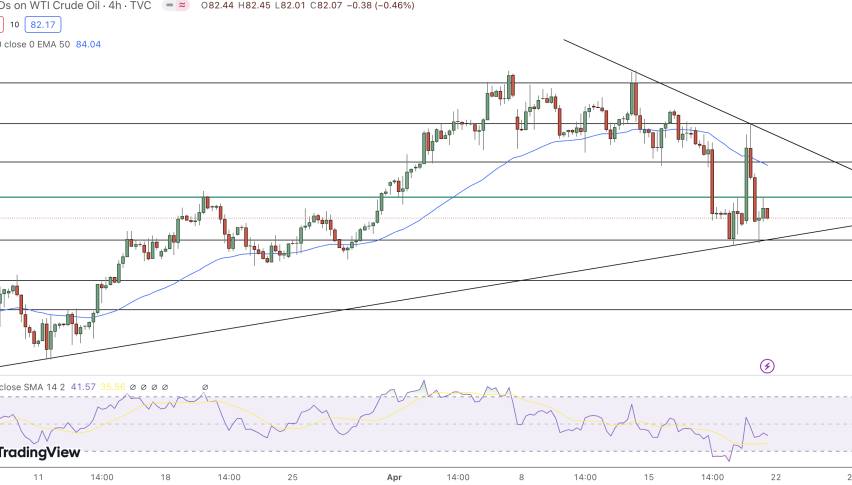
Selling the Jump in Crude Oil at Moving Averages
Oil prices opened more than $5 higher and above $80 following the OPEC+ surprise at the end of March, which decided to cut production. WTI continued to increase further early this month, but the decline last week weakened buyer confidence. The rejection occurred at the 200 SMA on the daily chart, which had buyers hoping for a break above $83.
As a result, the price started to fall back and today we saw WTI slip to $76.80, which had previously limited gains since November 2021 and is now acting as a critical support level. If this level is broken, that could open the door for sellers to push lower and fill the gap and target around 100 pips down at the important technical juncture around $75.65. This could lead to a move back towards $70, especially as global growth prospects are causing broader market uncertainty.
WTI Oil H1 Chart – Will the 100 SMA Hold As Resistance?

The climb in the US crude Oil seems to have stopped at the 100 SMA
Smaller moving averages such as the 20 SMA (gray) turned into resistance on the H1 chart during most of last week, but today we saw a retrace higher. The 20 SMA and the 50 SMA (yellow) were broken, but the climb has stopped at the 100 SMA (green) which might have turned into resistance.
So we decided to open a sell signal after the positive revision in the US retail sales for March. The US Commerce Dept has issued benchmark revisions to retail sales and that’s led to a positive change to the March data.
US March Retail Sales Revised Higher
- March retail sales revised to -0.6% from -1.0%
- Retail sales -0.6% vs -1.0% initially
- Ex autos to -0.4% vs -0.8% initially
- Ex autos and gas -0.3% vs -0.3% initially
- Ex autos, gasoline, building materials and food service -0.3% vs -0.3% initially
Revising benchmarks can be challenging since any positive revisions in the latest month may be offset by negative revisions in other areas. However, it appears that the revisions don’t indicate the same level of spending slowdown which is positive for the USD.


