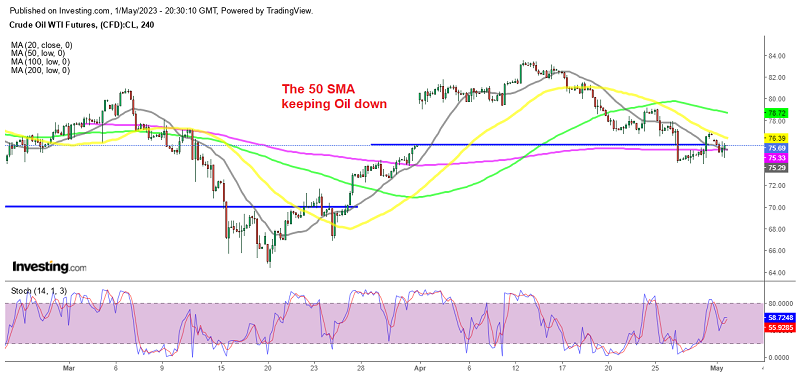
Has the 50 SMA Turned into Resistance for Oil?
Crude Oil has reversed down since the middle of April and moving averages are acting as resistance at the top, confirming the bearish trend
Crude Oil was bullish from the middle of March until the middle of April as the USD was retreating while risk sentiment turned positive, which helped commodities. Oil prices experienced a sharp decline on Monday due to weak Chinese manufacturing data, which raised doubts about the strength of the economic recovery in the world’s largest importer of crude. During the European session U.S. Oil futures were down by 2.5% at $74.50 a barrel, while Brent crude fell 2% to $78.76 a barrel.
The main reason for this decline was the slowdown in China’s manufacturing purchasing managers’ index which fell to 49.2 points from 51.9 points in March, which came as a surprise, given that Chinese Q1 growth had exceeded expectations. This highlighted the uneven nature of the recovery in China’s economy, which is the biggest growth driver for the crude demand growth expected to come later this year.
Meanwhile, the FED meeting is tomorrow and they are expected to hike interest rates for the last time this week, as part of its prolonged monetary policy tightening. This is expected to have a negative impact on the activity of the world’s largest consumer of crude, and has also boosted the value of the dollar, making oil more expensive.
On top of this, we have the ECB meeting tomorrow as well, which is also expected to hike interest rates by 25 bps, following the Fed’s lead, and the Bank of England is expected to do the same next week. These aggressive policy tightening by the major central banks are causing concern that Europe and the US might fall into recession later this year.
Despite the voluntary output cuts of just over 1 million barrels per day by OPEC+ that are taking effect in this month, the demand concerns have outweighed any positive impact on Oil. Now moving averages have turned into resistance and if the 50 SMA (yellow) rejects WTI, then we will try to open a sell Oil signal at this moving average.
US WTI Crude Oil Live Chart
- Check out our free forex signals
- Follow the top economic events on FX Leaders economic calendar
- Trade better, discover more Forex Trading Strategies
- Open a FREE Trading Account