The 200 Daily SMA Turns Into Support for USD/JPY
USD/JPY made a bullish break above 138 last week, but we saw a reversal back down on Friday, although the support held, helped by the 200 SM
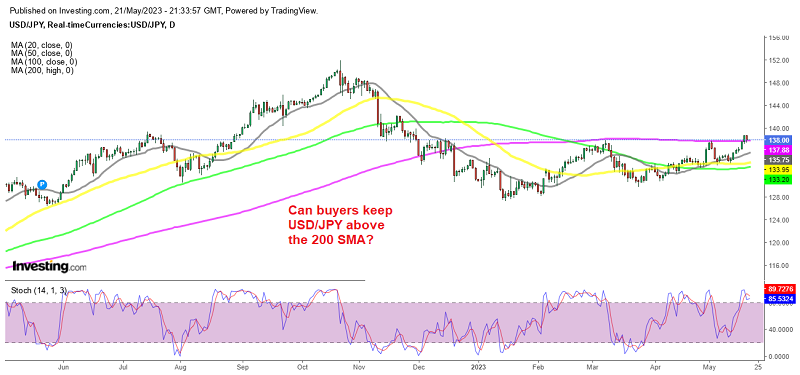
USD/JPY initially turned bullish earlier this year, but failed to break above the 200 SMA on the daily chart. The price retreated lower but recently retested this moving average without success. The pair advanced higher and broke the resistance zone around 138, where the 200 SMA is located.
The presence of the 200-day SMA was causing some hesitation among buyers. However, the overall trend suggested that buying momentum would continue after the rebound of the smaller moving averages. The recent bullish momentum has resulted in higher highs, indicating that pullbacks are likely to attract new buyers and strengthen the upward movement.
Last week this pair experienced a strong rally, breaking above the 200 SMA on the daily chart. This bullish move has reinforced the upward momentum and pushed the price above this year’s highs, reaching 138.76. Now the previous high at 138.00 has turned into support for this pair, with the 200 SMA also adding strength. With the current market sentiment favoring upward movement, there is a chance that the pair may surpass the 138.00 mark and achieve new yearly highs, potentially targeting 140.00 in the near term.
But on Friday USD/JPY experienced a downward movement due to Federal Reserve’s Powell remarks about banks reducing lending, the lowering of the terminal rate for the FED, and news that the US debt ceiling talks stalled. As a result, US yields and the USD declined.
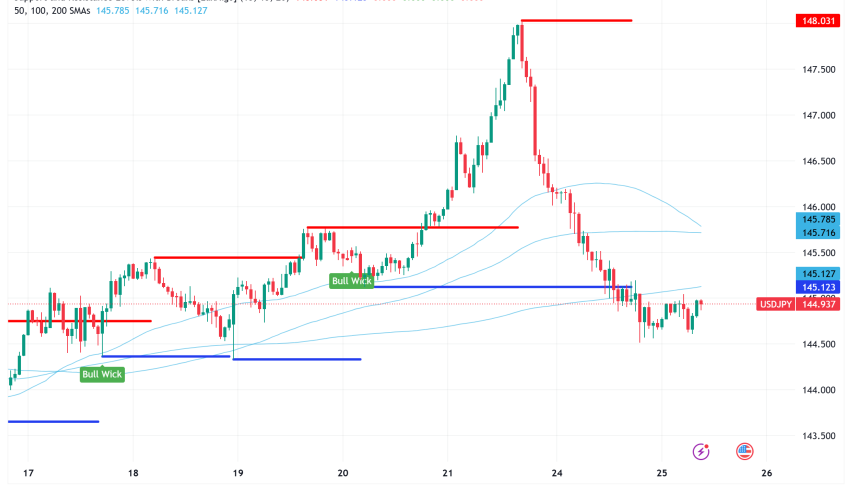
USD/JPY fell below the previous swing highs from March and May 2023, specifically at 137.76 and 137.91. The pair reached a low of 137.414 before bouncing back. Currently, the price is trading between those levels at 137.83. Traders are currently indecisive and evaluating whether to push the price back above 137.91, indicating a more bullish bias, or below 137.76, suggesting a more bearish bias in the short term.
USD/JPY Live Chart
- Check out our free forex signals
- Follow the top economic events on FX Leaders economic calendar
- Trade better, discover more Forex Trading Strategies
- Open a FREE Trading Account