Forex Signals Brief May 24: RBNZ Hike, UK CPI and FOMC Minutes Today
Today we have the Reserve Bank of New Zealand hiking rates again, the CPI inflation report from the UK and the FOMC meeting minutes

Yesterday’s Market Wrap
Yesterday started off with Manufacturing and Services MI report from Australia and Japan for May, with manufacturing activity turning to expansion in Japan, while remaining in contraction in most of the developed world, as we saw later from numbers coming out from Europe. Services on the other hand, remain in a decent shape.
In US, manufacturing also fell in contraction, dipping below 50 points. The USD dipped at the start of the US session but then started to recuperate again and resume the bullish momentum, which shows that the larger retreat might be over for the Buck. US new-home sales for April beat expectations though, coming at 0.683 million against 0.665 million expect.
Today’s Market Expectations
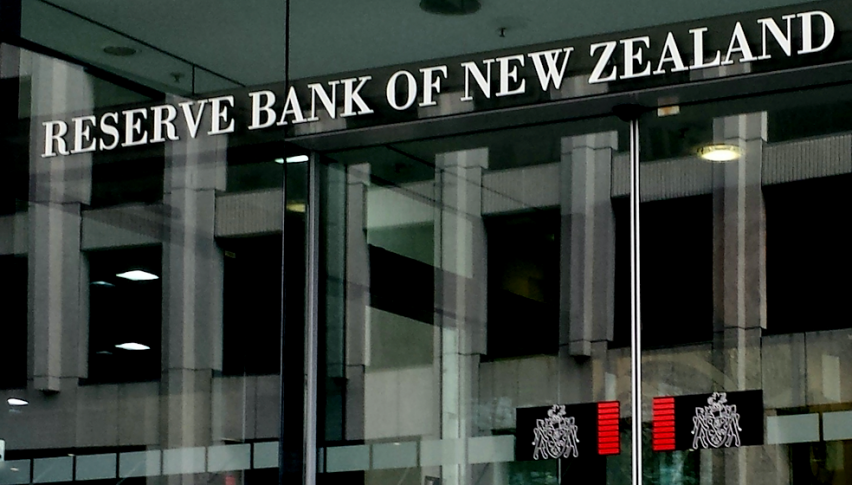
Today started with the retail sales report from New Zealand which showed a return to growth in Q1 after declining in Q4 of last year. The Reserve Bank of New Zealand met expectations delivering a 25 bps rate hike, taking them to 5.50%. The UK consumer inflation repot was release this morning, showing a decline below 10% for the first time in nearly a year. The Bank of England Governor Andrew Bailey will hold two speeches later, so we will follow the GBP. The FOMC minutes from the last meeting will close the day.
Forex Signals Update
Yesterday there was some price action which enabled us to open several trades although the volatility was not too high. We opened four forex signals in total, all of which closed in profit as we remained long on the USD, although two more trading signals remained open until today.
The 100 SMA Turning Into Resistance for GOLD
Gold made a bearish reversal in the first few days of this month, after failing to break the all-time high around $2,075. Moving averages which provided support at first were eventually broken and the 100 SMA (green) has turned into resistance recently. We opened two sell Gold signals against this moving average yesterday.

XAU/USD – H4 chart
EUR/USD Testing Last Week’s Low
Over the past two weeks, the EUR/USD pair has experienced a bearish trend, primarily due to the resurgence of USD buyers driven by improved economic data. This has resulted in a decline of approximately 3 cents in the pair’s value. On the H1 chart, the moving averages have turned into resistance and our sell forex signal at the 100 SMA (green) hit the take profit target yesterday.
 AUD/USD – Daily chart
Cryptocurrency Update
BITCOIN Remains Supported by the 100 SMA
Since April, Bitcoin has been experiencing a bearish trend, marked by a series of lower lows. However, there has been a period of consolidation lasting around 10 days, with the price fluctuating above and below the $27,000 level. During this time, the price dropped below the 50 Simple Moving Average (yellow) on the H4 chart, which is currently acting as a resistance level.

BTC/USD – Daily chart
ETHEREUM Testing the 50 SMA
In recent weeks, the buying pressure for Ethereum has slowed down, and we have witnessed a retreat in its price over the last few days. However, the correction appears to be nearing completion as the BTC/USD 50 SMA (yellow) is holding as support. Additionally, the stochastic indicator is showing an oversold condition. Considering these factors, we decided to open a buy signal for ETH some time ago.

ETH/USD – Daily chart
- Check out our free forex signals
- Follow the top economic events on FX Leaders economic calendar
- Trade better, discover more Forex Trading Strategies
- Open a FREE Trading Account
 AUD/USD – Daily chart

