USD/JPY Showing Signs of Another Bullish Run to 145
USD/JPY continues to make higher lows despite a retreat in the USD which shows that buyers are preparing for another round
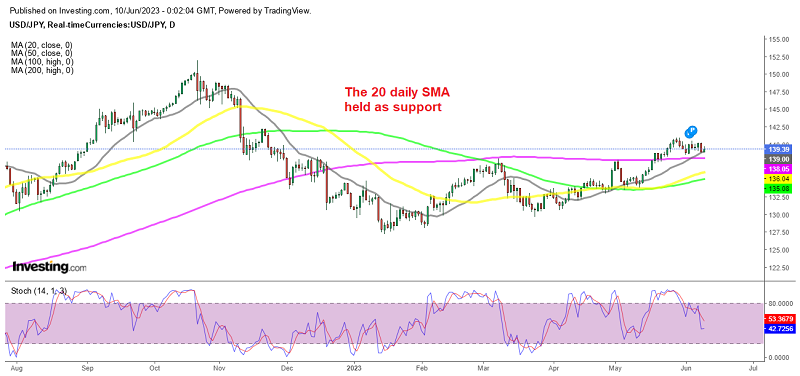
USD/JPY has been bullish since early January and in late May, this currency pair reached its highest level for the year jut below 141. However, it experienced a retreat to around 138.40 by the end of last month, due to concerns about potential intervention by Japanese authorities. This led to four consecutive days of losses. Additionally, the decrease in US Treasury bond yields contributed to the USD weakening and bearish price action in USD/JPY .
After reaching the 138.40s area, a bullish engulfing candlestick pattern formed on the daily chart, indicating a potential reversal in the price movement. This pattern created a support level around 138.40s. Although, on Thursday,we witnessed a strong USD selloff after a weak unemployment claims report for May, and sellers attempted to break below the 20-day Simple Moving Average (gray) at 138.70, but they were unsuccessful, which helped maintain the support level.
As a result, buyers are now preparing to push the price back up towards the 140.00 level. On Friday, the price action was slower comapated to the previous day, but this pair closed the day 60 pips higher nonetheless, which means that buyers are starting to come back.
Another reason that the Japanese Yen experienced selling pressure yesterday was a Report which circulated that the Bank of Japan still sees the need to continue implementing monetary stimulus measures. This means that the BOJ won’t tighten the monetary policy anytime soon this year and surely not in the years to come. The question now is whether the US data and the FED will change the bullish sentiment.
Since the appointment of a new BoJ Governor earlier this year, there has been speculation about a potential policy shift. On Thursday, the Yen saw increased demand as GDP data exceeded expectations. This likely reignited hopes of a policy pivot which sent this pair to a low around the 138.80 level. But the 20 daily SMA held and now the price should continue toward 141 first and then to 145.
USD/JPY Live Chart
- Check out our free forex signals
- Follow the top economic events on FX Leaders economic calendar
- Trade better, discover more Forex Trading Strategies
- Open a FREE Trading Account
- Read our latest reviews on: Avatrade, Exness, HFM and XM
Related Articles

Sidebar rates
Related Posts
