Major Test at the 100 Daily SMA for EUR/USD Traders
EUR/USD is testing the 100 SMA as resistance on the daily chart which used to act as support
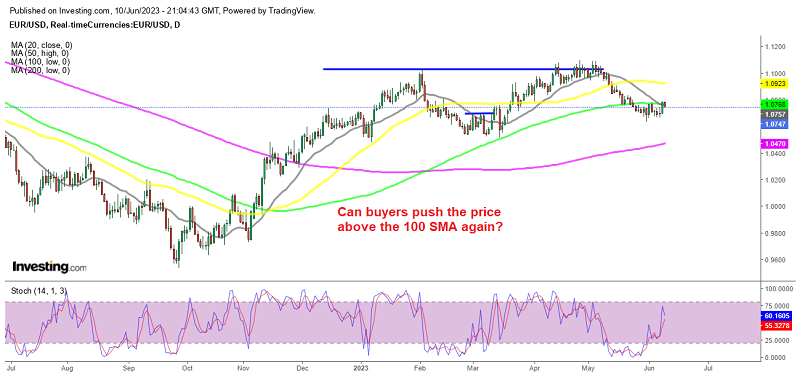
EUR/USD experienced a significant reversal late last year after being bullish since 2021. Following this reversal, the pair climbed more than 15 cents higher as the Federal Reserve (Fed) slowed down its rate hikes. However, buyers were unable to push the price above the 1.11 level, and early last month, indications of a bearish reversal started to emerge. Buyers failed to surpass the 50-period Simple Moving Average (SMA) represented by the yellow line on the daily chart, suggesting a potential resumption of the long-term bearish trend.
Over the past few weeks, the yield on US Treasury bonds, particularly the 10-year benchmark note rate, has risen by more than ten basis points, reaching 3.766%. This increase was triggered by the Bank of Canada (BoC) raising rates, following previous meetings where rates remained unchanged. The BoC’s decision to increase rates places them among the G10 central banks that have paused rates but had to take swift action due to inflation proving more persistent than initially anticipated.
The European Central Bank (ECB) has expressed the view that aggressive tightening measures take longer than usual to have an impact on the economy. These recent developments reflect the actions and statements of central banks, such as the Bank of Canada raising rates in response to persistent inflation, and the ECB signaling the need for rate increases to combat inflation, while also considering the timing and pace of such moves.
Last week we saw a retrace higher in this pair after the higher-than-expected unemployment claims in the US which jumped most since October 2021. This sent the USD lower and improved the sentiment, but the 100 SMA (green) turned into resistance and buyers failed to push the price higher, so chances are that we will see a bearish reversal this week.
Additionally, it is worth noting that the stochastic indicator on the daily chart is currently in the overbought territory. Taking these factors into consideration, some traders may interpret this chart setup as a potential opportunity to open a long-term sell position on the EUR/USD pair.
EUR/USD Live Chart
- Check out our free forex signals
- Follow the top economic events on FX Leaders economic calendar
- Trade better, discover more Forex Trading Strategies
- Open a FREE Trading Account