MAs Keeping Crude Oil Down, As EIA Inventories Accumulate
Crude Oil hasn’t been able to find some solid footing and build a bullish trend, while yesterday oil prices moved lower again following the release of the Energy Information Administration’s report, which indicated an estimated inventory build of 7.9 million barrels for the week ending June 9. This contrasts with a small inventory draw of 500,000 barrels reported for the previous week and an estimated build of slightly over 1 million barrels reported by the American Petroleum Institute on Tuesday.
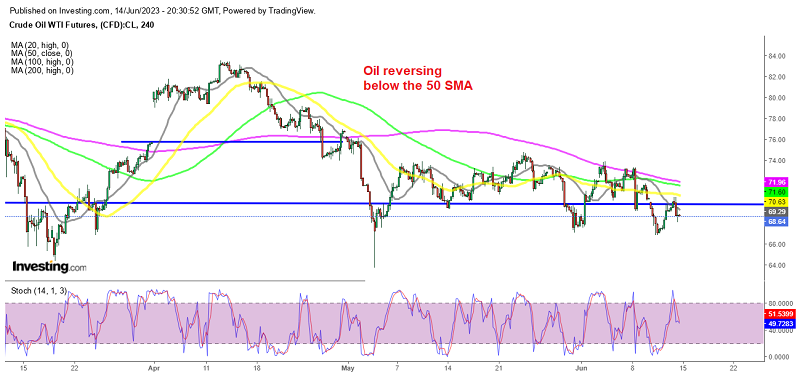
During the previous day, we saw a retreat in the USD as CPI inflation slowed down more than expected, while yesterday the USS producer inflation PPI also slowed, which kept pushing the USD lower. Oil was retracing higher on the other hand. But the price reversed below the 50 SMA (yellow) on the H4 chart, which stood at around $70.70.
The buildup in the EIA inventories gave the sellers a reason to enter the market, while the FED dot plot gave the USD a push higher, while Oil another reason to decline. The FED kept interest rates unchanged at 5.25% but the projections for rates at the end of the year were higher. The median DOT plot of the FOMC members showed two more rate hikes until the end of 2023, which is hawkish by them, considering that inflation is cooling off further. This means a stronger USD but more difficulties for the global economy, which means slowed demand for energy and Oil. So, crude Oil ended lower nd will likely resume the bearish trend.
Weekly Crude Oil Inventories from the US EIA
- Crude oil inventories +7919K vs -510K expected
- Prior week inventories were -451K
- Gasoline +2108K vs +316K expected
- Distillates +2123 vs +1208K expected
- Refinery utilization -2.1% vs +0.1% expected
- SPR draw of 1.9 million barrels
Private oil inventories released late yesterday:
- Crude +1024K
- Gasoline +2075K
- Distillates +1394K


