Steady Downtrend in EUR/GBP After UK Inflation Numbers
EUR/GBP remains on a strong bearish trend, with moving averages acting as resistance, despite slowing UK inflation
•
Last updated: Tuesday, June 20, 2023

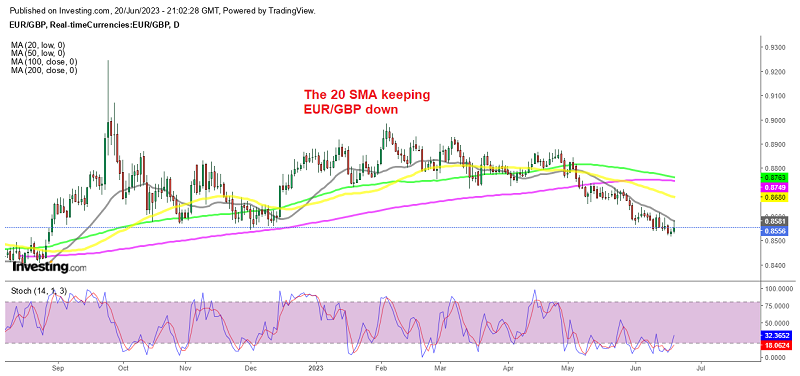
EUR/GBP was on a bullish trend since early 2022, although it started making lower highs in February and since late April the decline has accelerated as inflation between the UK and the Eurozone starts to diverge. This pair has lost around 330 pips since then with the 20 SMA (gray) acting as resistance on the daily chart, showing that the pace of the decline is strong.
The Eurozone CPI (consumer price index) inflation has fallen much faster than in the UK, where it remained above 10% for a prolonged period. Today we had the UK consumer inflation numbers in the morning, which also showed a decline as expected.
UK May CPI Inflation Report
EUR/GBP Live Chart
EUR/GBP
- Check out our free forex signals
- Follow the top economic events on FX Leaders economic calendar
- Trade better, discover more Forex Trading Strategies
- Open a FREE Trading Account
ABOUT THE AUTHOR
See More
Skerdian Meta
Lead Analyst
Skerdian Meta Lead Analyst.
Skerdian is a professional Forex trader and a market analyst. He has been actively engaged in market analysis for the past 11 years. Before becoming our head analyst, Skerdian served as a trader and market analyst in Saxo Bank's local branch, Aksioner. Skerdian specialized in experimenting with developing models and hands-on trading. Skerdian has a masters degree in finance and investment.


