Forex Signals Brief July 4: Quiet Markets on 4th of July After RBA Meeting
Yesterday we saw a retreat in the USD as the ISM manufacturing and manufacturing prices kept declining, while today the price action is expe

Yesterday’s Market Wrap
The markets exhibited a mixed performance yesterday, starting off slowly after the weekend. However, the volatility picked up later as the US dollar weakened during the European session and particularly in the US session. Crude oil, experienced a significant increase of around $2 after Saudi Arabia announced an extension of the output cut for another month.
Ingthr Asian session, the Caixin Manufacturing Index for June indicated a further slowdown in China, but the reading exceeded expectations, contributing to positive market sentiment. Sentiment improved further following the release of softer manufacturing data from the US, which revealed a decline in manufacturing prices. This suggests that prices for finished goods are likely to decrease in the coming months, reducing the pressure on the Federal Reserve to raise interest rates beyond the anticipated hike in July. Consequently, the US dollar weakened by approximately 30-40 pips against other currencies. However, we took advantage of this opportunity to buy USD/JPY, as the bullish trend in this pair remains strong.
Today’s Market Expectations
Today the economic calendar is light apart from one event in the Asian session, so the volatility is expected to be low. The Reserve Bank of Australia met earlier today, and expectations were for them to pause rate hikes, after the unexpected hike in June, taking them to 4.10%. They kept rates unchanged this time so traders are focused more on the future path for their monetary policy. In the European session, we have the Spanish Unemployment Change, while in the US session, we have the Manufacturing PMI from Canada. The US markets are closed today for Indipendence Day, so the price action will get slower after the European markets are closed.
Forex Signals Update
Yesterday the price action was not too volatile but it was enough for us to pull several trades, some of which we had opened from last week. At the end of the day we finished with three wining forex signals and two losing ones, most of which were USD/JPY trades.
GOLD Forming A Bullish Reversing Pattern
Gold has been in a bearish trend since early May, even as the value of the US dollar has been declining. This suggests that there has been a decrease in demand for the precious metal. Last week, on Wednesday, the price of gold dropped below $1,900. However, it quickly reversed its downward movement following the release of some weak economic data from the US and a doji candlestick at the bottom. Yesterday the price climbed above $1,930 but then retraced lower and closed another doji candlestick, so let’s see if we will see a reversal down now.

XAU/USD – Daily chart
We Continue to Buy USD/JPY
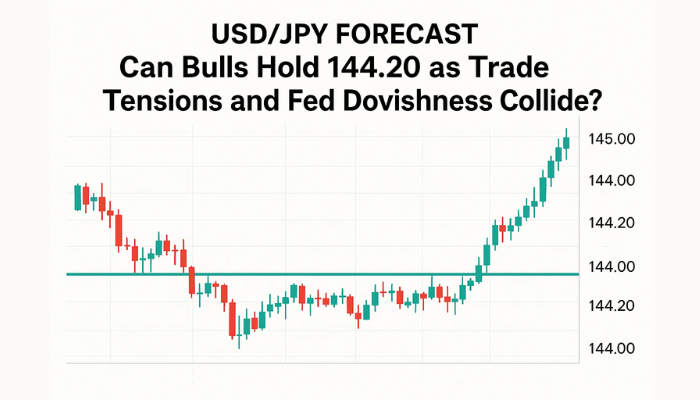
USD/JPY has been making significant gains throughout the past month, despite the overall weakness observed in the US dollar towards the end of the week. The trend has been consistently bullish since late April, with the price approaching the key level of 145. Moving averages have served as reliable indicators of support. As a result, the strategy will be to continue buying on retracements in this currency pair, as well as in EUR/JPY.

USD/JPY – 60 minute chart
Cryptocurrency Update
BITCOIN Establishes Above $31,000
Bitcoin experienced a notable shift in sentiment in mid-June, leading to a bullish trend in the cryptocurrency market. BTC/USD saw a surge above $31,000, indicating increased buying activity. However, the price has encountered resistance in moving higher, resulting in a period of consolidation. As a result, the price temporarily dropped below the $30,000 mark once again. Currently, both buyers and sellers appear relatively weak, leading to the price hovering around this level without significant momentum in either direction.

BTC/USD – Daily chart
Booing Profit in ETHEREUM
By the middle of last month there was a notable surge in cryptocurrencies, with the ETH/USD pair rising above the $1,900 level. However, it failed to reach our predetermined take-profit target and subsequently began to retreat lower. Following a period of consolidation, the price started to decline. Initially, the 50-day Simple Moving Average (SMA) provided support, but it was eventually broken. Fortunately, the decline was halted by the 200-day SMA, acting as a support level.

ETH/USD – Daily chart
- Check out our free forex signals
- Follow the top economic events on FX Leaders economic calendar
- Trade better, discover more Forex Trading Strategies
- Open a FREE Trading Account


