Forex Signals Brief July 5: FOMC Minutes in Focus for Clues on Hikes
Yesterday the USD was retreating as US markets were closed, while today it might get another push lower from the FOMC minutes

Yesterday’s Market Wrap
The US was on holiday for the 4th of July yesterday, although trading remained active. The main event was the surprise dovish stance from the Reserve Bank of Australia (RBA), which decided to keep interest rates unchanged, but that was expected. This decision initially led to a sell-off in the Australian dollar (AUD), but it quickly reversed and rallied as investors digested the news.
Commodity prices, particularly oil, performed well as the market assessed the impact of OPEC+ production curbs. While there was a reversal in sentiment from the previous day, the market is likely to experience further developments in this ongoing saga. In Canada, the local Purchasing Managers’ Index (PMI) showed a slight softening, suggesting that the Bank of Canada (BOC) may need to reconsider its plans for an interest rate hike next week. The US dollar exhibited weakness overall but regained some strength later in the day.
Today’s Market Expectations
Today the economic calendar is light again, with the main event being the FOMC minutes from the last FED meeting, when they decided to pause rate hikes. Markets will be watching for clues in the comment about how many rate hikes the FED is planning to conduct. The DOT PLOT showed two more hikes, but markets are convinced of just one more hike. Although inflation has been slowing since then, so these comments are a bit outdated, but traders are still following.
The Caixin services are expected to show a slowdown in China, while the final reading for European services PMI is not expected to show any change. The OPEC meetings also taking place today, so we will see what impact it will have on Oil prices.
Forex Signals Update
Yesterday the price action was not too volatile but it was enough for us to pull several trades, some of which we had opened from last week. At the end of the day we finished with three winning forex signals and two losing ones, most of which were USD/JPY trades.
NZD/USD Forming A Bullish Reversing Pattern
NZD/USD has been following a downtrend since early February, characterized by lower highs. Recently, the 100-day Simple Moving Average (SMA) has acted as resistance, further confirming the bearish trend. The price was rejected by this moving average in the middle of last week, resulting in a 200-pip decline. However, in the past three days, there has been a significant reversal. This reversal was preceded by a doji candlestick pattern, indicating a potential bullish reversal, followed by three consecutive bullish candles known as “three soldiers up.”

XAU/USD – Daily chart
Remaining Long on USD/JPY
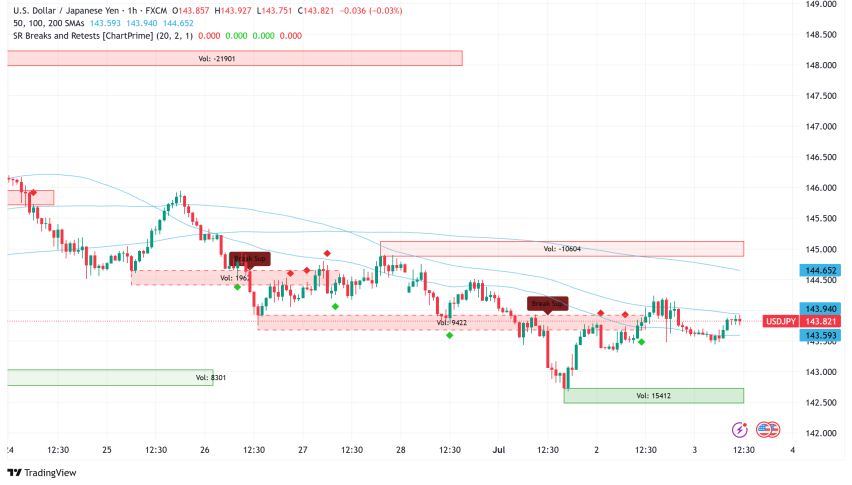
USD/JPY has been making significant gains throughout the past month, despite the overall weakness observed in the US dollar towards the end of the week. The trend has been consistently bullish since late April, with the price approaching the key level of 145. Moving averages have served as reliable indicators of support. As a result, the strategy will be to continue buying on retracements in this currency pair, as well as in EUR/JPY.

USD/JPY – 60 minute chart
Cryptocurrency Update
Will the 50 SMA Hold for BITCOIN?
Bitcoin surged higher in June as the sentiment turned bullish in the crypto market. Eventually, BTC/USD saw a surge above $31,000, indicating increased buying activity. However, the price has encountered resistance in moving higher, resulting in a period of consolidation. After the last spike above $31,000, we have seen a retreat lower, but it seems like the 50 SMA is holding for BTC.

BTC/USD – 240 minute chart
The Previous Highs Might Turn Into Support for ETHEREUM
By the middle of last month there was a notable surge in cryptocurrencies, with the ETH/USD pair rising above the $1,900 level. However, it failed to reach our predetermined take-profit target and subsequently began to retreat lower. Following a period of consolidation, the price started to decline. Initially, the 50-day Simple Moving Average (SMA) provided support, but it was eventually broken. Fortunately, the decline was halted by the 200-day SMA, acting as a support level.

ETH/USD – Daily chart
- Check out our free forex signals
- Follow the top economic events on FX Leaders economic calendar
- Trade better, discover more Forex Trading Strategies
- Open a FREE Trading Account