WTI Crude Oil Technical Analysis: WTI clears weekend losses, next target 74
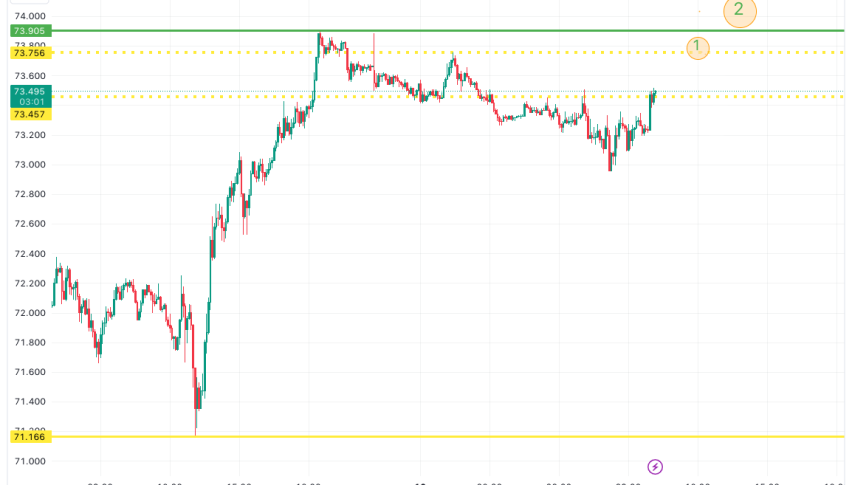
There are two important levels to watch on the 24-hour WTI Crude Oil (USOIL) price chart:
- Two upward channels heading towards 73 and 74.
- A low downside at 71.65, a key resistance line.
The black liquid has already broken above the 100-day Simple Moving Average (SMA), a zone where the bulls have faced rejection multiple times over the last 14 days. 100-day SMA is at $73.75-$73.85.However, a difficult opening of the week saw the asset drop to $72.99. Buyers have already cleared the losses and seem to be headed for the SMA. The Western Texas Intermediate Crude oil is also up by 4% in gains over the last 7 days. Rallying from $67 and sustaining strong momentum above the 50-day Simple Moving Average indicates overal bullishness. It’s possible to reinforce the bullish theorem using a combination of data points from TradingView oscillators and major indicators.
WTI short-term price action
In the current technical analysis of WTI Crude Oil (USOIL), the market sentiment appears mixed, leaning slightly towards a bullish bias. Indicators present a diverse range of opinions, with 7 sell signals, 9 neutral signals, and 10 buy signals. This indicates that market participants have varying views on the future direction of the price.
Examining the oscillators, the market momentum is relatively balanced, with 2 sell signals, 8 neutral signals, and 1 buy signal. According to this data, there is no clear dominance of either buyers or sellers at the moment.
Additionally, the moving averages indicate a more bullish outlook. With 5 sell signals, 1 neutral signal, and 9 buy signals, the moving averages suggest a higher probability of price appreciation in the near term.
Meanwhile, it is vital to note USOIL touched the exponential moving average (EMA) at 71.60 yesterday, indicating a potential level of interest for sellers. The bears might be aiming for a retest of this point in the short term, which could result in increased selling pressure.
Fundamentals
Finally, Saudia Arabia and Russia will reduce their supply in August. This also adds to the bullish perspective, however, Monday’s release of China’s economic data indicates some bearish pointers, including slowing economic growth in the world’s second large economic powerhouse.
- Check out our free forex signals
- Follow the top economic events on FX Leaders economic calendar
- Trade better, discover more Forex Trading Strategies
- Open a FREE Trading Account
- Read our latest reviews on: Avatrade, Exness, HFM and XM
Related Articles


Sidebar rates
Related Posts
