GBP/USD’s Rebound and Retreat after facing strong rejection at 1.2950

The GBP/USD currency pair has been facing significant challenges recently as it encountered critical resistance above the 1.2950 level. This resistance has been a major psychological barrier for investors, and many are cautious about the potential of a breakout. The recent trend of softening inflation expectations in the United Kingdom added to the uncertainty, leading investors to be hesitant about the Bank of England’s (BoE) stance on interest rates.
In June, the United Kingdom’s inflation showed signs of softening, indicating that the economy’s inflation rate is below average. This development could potentially prompt the BoE to tighten its monetary policy to stimulate economic growth. However, investors seem to be concerned that a substantial interest rate hike by the BoE might not be the best course of action, given the current state of the U.K economy.
Amidst these concerns, the GBP/USD has been facing bearish pressure, as reflected in its fourth consecutive day-to-day losing streak. The price attempted to break above the Rising Channel chart pattern but was met with massive selling pressure, preventing it from breaking through the critical resistance level.
On the positive side, there was some buying interest near the 20-day Exponential Moving Average (EMA) at around 1.2860, which led to a slight rebound. However, the rebound was short-lived, and the price resumed its downward movement, indicating a bearish sentiment prevailing in the market.
The majority of indicators are giving a positive signal (buy) for the GBP/USD. This might indicate that many technical analysis tools are showing a bullish sentiment in the market. However, it’s essential to consider the specific indicators used and their reliability to determine whether this sentiment is strong enough to drive a significant upward movement.
Oscillators, which are momentum indicators, show a mixed picture. While two of them signal a buy, indicating some upward momentum, the majority are neutral, suggesting a lack of clear direction in the short term. The one oscillator signalling a sell could indicate some bearish momentum, but it’s not enough to outweigh the neutral and buy signals.
Moving averages that provide insights into the overall trend direction have ten moving averages suggesting a buy. This suggests that the market sentiment is tilted towards the upside. However, it’s crucial to note that three moving averages signal a sell, indicating some conflicting signals. The neutral moving average means there is some uncertainty in the short-term trend.
The Relative Strength Index (RSI) stands at 53.35, indicating a neutral stance for the GBP/USD at the moment. The 20-day Exponential Moving Average (EMA) currently sits at 1.28649, and the 50-day Simple Moving Average (SMA) is at 1.26478.
Considering the Bull Bear Power, which is negative at -0.00085, there might be some buying interest, but it’s not strong enough to reverse the bearish trend. The MACD is at 0.0009967, suggesting a buy signal, but again, it’s not substantial enough to drive a significant upward movement.
In conclusion, the GBP/USD has encountered critical resistance above 1.2950 and faces challenges due to investors’ uncertainty about the Bank of England’s policy tightening and the softening inflation expectations in the United Kingdom. The ongoing day-to-day losing streak and the inability to break above the Rising Channel pattern add to the bearish sentiment.
While there are some signs of buying interest near the 20-day EMA, the overall technical analysis, along with the provided data points, indicates a neutral to a bearish outlook for the GBP/USD in the short term. Traders and investors should closely monitor the developments and any potential changes in economic data and central bank policies to make informed decisions about their positions.
GBP/USD Technical Analysis Chart
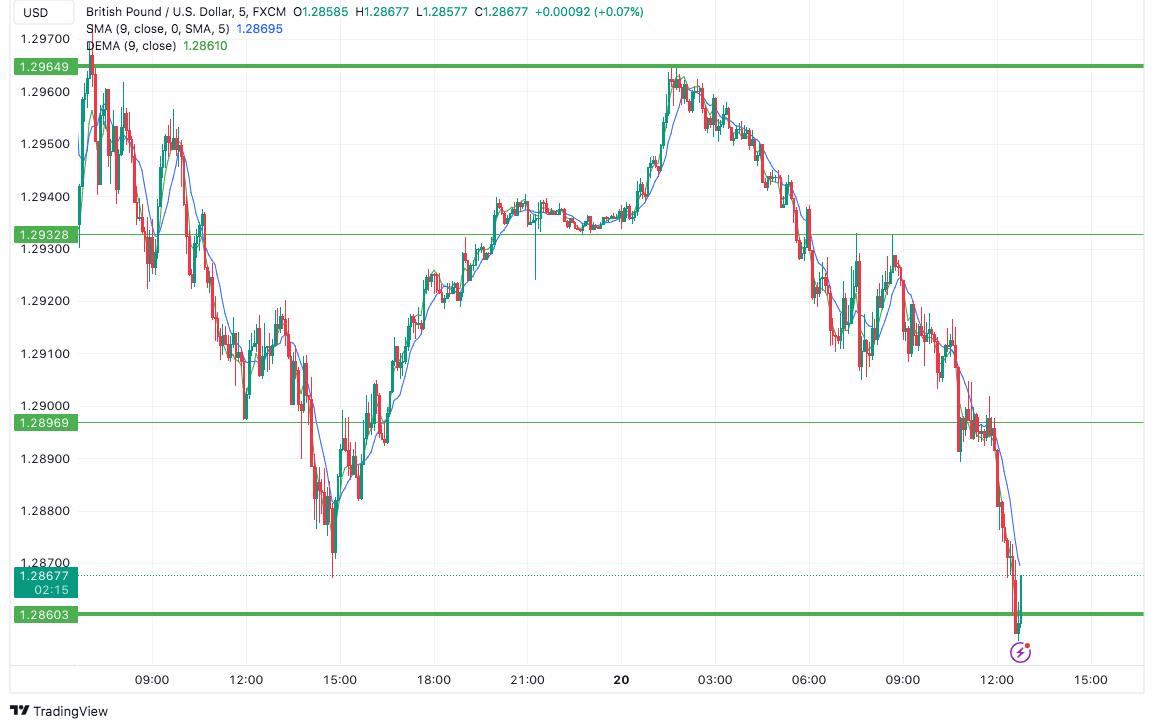 GBP/USD currency pair has been facing significant challenges recently as it encountered critical resistance above the 1.2950 level” width=”1154″ height=”759″ />
- Check out our free forex signals
- Follow the top economic events on FX Leaders economic calendar
- Trade better, discover more Forex Trading Strategies
- Open a FREE Trading Account
- Read our latest reviews on: Avatrade, Exness, HFM and XM
Related Articles


Sidebar rates
Related Posts
