USD/JPY’s Correction Trend Reaches 141.00 Amid Fed-BoJ Policy Divergence

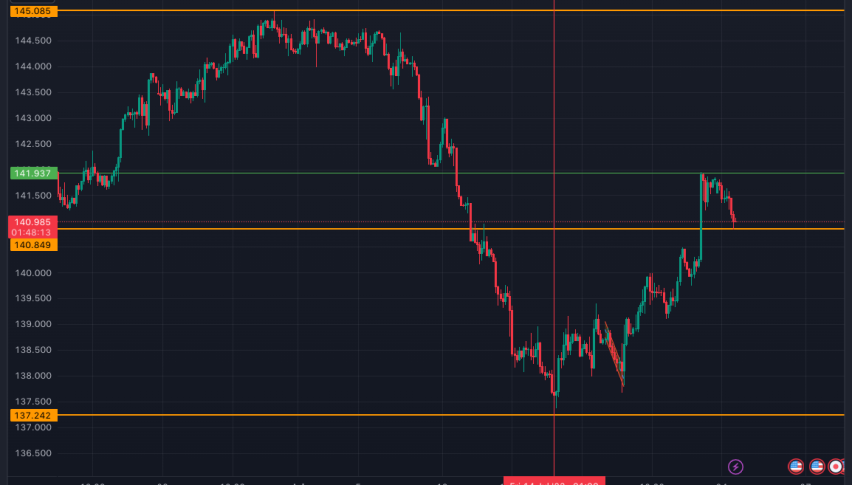
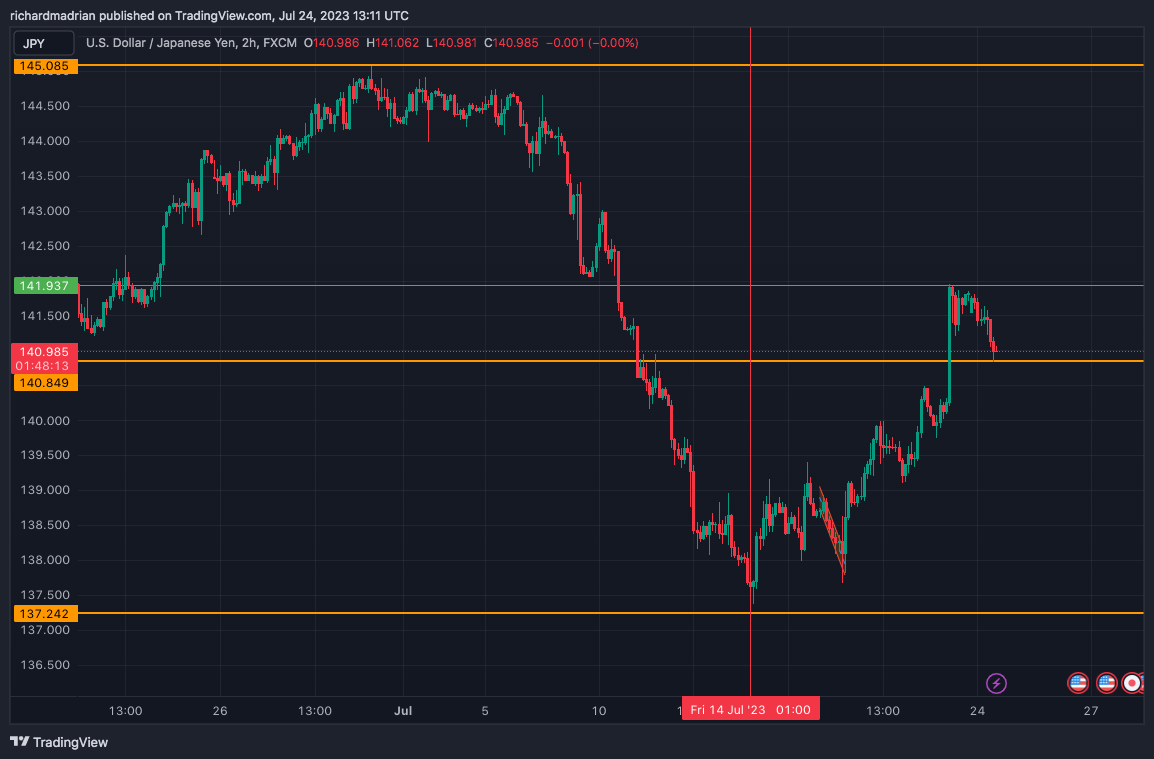
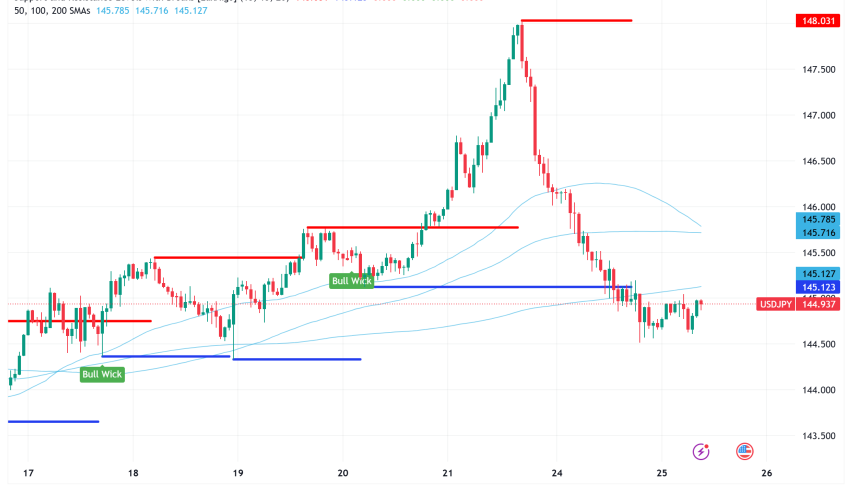
The USD/JPY currency pair has been experiencing notable fluctuations in recent days. On July 14th, the pair reached a low of 137.889, which coincided with the 100-day simple moving average. This level appears to have provided some support for the pair, preventing further downside momentum.
However, as the pair attempted to recover, it faced resistance at the 20-day simple moving average, which was situated at 141.093. The rejection at this level indicates that there is some selling pressure prevailing in the market, preventing a swift upward movement for USD/JPY.
One significant factor contributing to the current uncertainty is the upcoming interest rate decisions by both the Federal Reserve (Fed) and the Bank of Japan (BoJ). The Fed is expected to announce its decision on July 26, while the BoJ will follow suit on July 28. Market participants are anticipating a further increase in interest rates by the Fed, as inflation in the United States remains above the desired rate of 2%. This expectation is likely to impact the USD/JPY pair, as higher interest rates in the US typically attract investors and strengthen the US dollar.
The US Dollar Index (DXY) saw a loss in its entire gains after reaching an intraday high of 101.40. This suggests that there is some hesitancy among investors, possibly awaiting preliminary data from the S&P Global PMI to gain a clearer view of the economic situation. Such uncertainty can also influence the USD/JPY pair’s movements.
On the other hand, the BoJ Governor, Kazuo Ueda, has emphasized the need for a dovish interest rate policy to maintain inflation steadily above 2% in Japan. This stance may contribute to a weaker Japanese yen, potentially providing some support for USD/JPY.
Analyzing the technical indicators, we find that there are mixed signals. The Moving Averages present a somewhat bullish outlook, with 10 indicators suggesting a buy signal. However, the MACD is showing a slight bearish bias, indicating that the pair might be under some selling pressure in the short term. Additionally, the oscillators are mixed, with 9 neutral readings and only 1 buy signal.
The relative strength index (RSI) currently stands at 51.626, which implies that the pair is neither oversold nor overbought. This balanced RSI reading indicates that there is room for the currency pair to move in either direction, depending on the outcome of the upcoming central bank decisions and other market developments.

In conclusion, USD/JPY is currently facing resistance near the 20-day simple moving average, while finding support around the 100-day simple moving average. The upcoming interest rate decisions by the Fed and the BoJ, along with market sentiment surrounding inflation and economic data, will likely play a crucial role in determining the pair’s future direction. Traders should closely monitor these developments and exercise caution in their trading strategies, given the mixed signals from the technical indicators.
- Check out our free forex signals
- Follow the top economic events on FX Leaders economic calendar
- Trade better, discover more Forex Trading Strategies
- Open a FREE Trading Account


