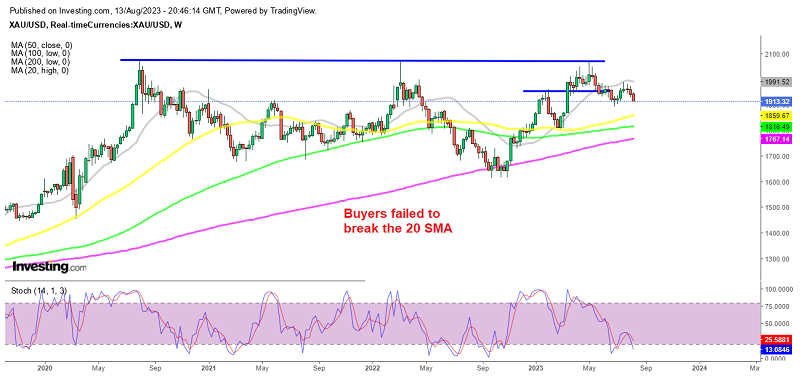
Bearish Reversing Pattern Gold, After Failing at the 20 Weekly SMA
Gold closed another negative week, forming a bearish reversing pattern as the demand for the USD increases

Gold was bullish until early May, when it retested the all-time highs from back in 2020 and 2022 at around $2,075, but after failing there for the third time, it seems like buyers gave up. A reversal took place in May and after a failed attempt from buyers to resume the bullish trend about a month ago, it seems like sellers have resumed control gain and are gearing up to push the price below $1,900 now, which will likely happen this week.
Buyers were pushing the price higher at the end of July and they reached the 20 SMA (gray) on the weekly chart, but that moving average turned into resistance and Gold formed two doji weekly candlesticks, which are bearish reversing signals after the climb. The price reversed back down and resumed the decline as soon as August started, with two bearish weekly candlesticks, which has taken the price down from $1,980 to $1,913 where XAU/USD closed last week.
The bearish reversal earlier this month came after the FED left the future of rate hikes depending on the economic data, which have been sort of mixed. Last week the price of Gold experienced downward pressure due to an increase in the United States Producer Price Index (PPI) and Consumer Price Index (CPI) for July, although the core CPI did tick down. While the precious metal made an effort to rebound, there wasn’t any strong justification for an upward movement as investors remained concerned about persistent inflation, especially given the upward trajectory of rental prices.
Both consumer and producer inflation saw an uptick in July and the USD ended up getting stronger, although it is not substantial enough to compel the Federal Reserve (FED) to consider another interest rate hike in September. So, the pressure in GOLD continues to remain on the downside and we will be looking to sell retraces higher on smaller timeframes this week.
Gold XAU Live Chart
- Check out our free forex signals
- Follow the top economic events on FX Leaders economic calendar
- Trade better, discover more Forex Trading Strategies
- Open a FREE Trading Account


