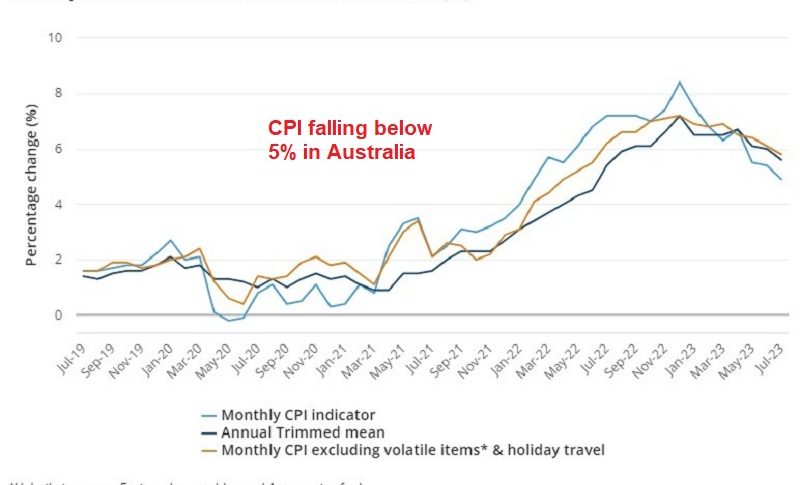
Weak Bounce in AUD/USD As CPI Falls Below 5%
AUD/USD is resuming the bearish momentum again after the retreat above 0.65 where it met the 20 daily SMA
AUD/USD turned bearish for more than a month since the middle of July, but after falling below the 0.64 level where this pair found some support, we saw a reversal that lasted two weeks, although this seems to be over now after buyers failed to push the price above the 20 SMA (gray) on the daily chart. They pierced the 20 SMA a couple of times, but there was no close above it, and after two doji candlesticks which are bearish reversing signals, Friday closed with a bearish candlestick.
This pair was declining on positive economic numbers from the US earlier in August, although last week we saw some weak employment numbers which sent the Buck lower until Friday. On Friday, the US reported a mix of Nonfarm Payrolls figures and strong PMI data, while the Australian economic calendar lacked any significant developments, making the USD the primary driver of currency pair movements the Nonfarm Payrolls report revealed that the US added 187K jobs last month. This figure was slightly higher than the anticipated 170K and an improvement from the downwardly revised 157K in July. On a less positive note, the Unemployment rate also rose to 3.8% in the same month.
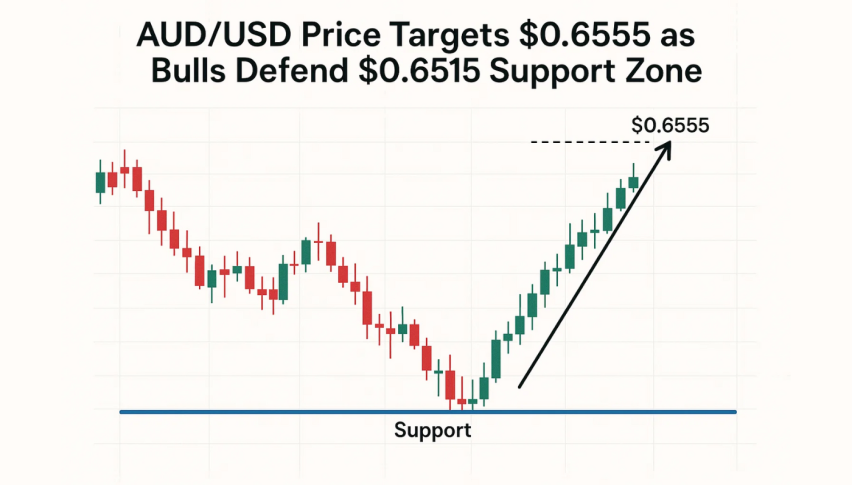
AUD/USD Daily Chart – The 20 SMA Held As Resistance

The retrace in AUD/USD seems complete after two doji candlesticks
However, what bolstered the USD’s performance were the findings from the Institute for Supply Management (ISM), which reported PMI figures for August exceeding expectations. Specifically, the manufacturing index stood at 47.6 points, surpassing the 47 points expected. This data pointed to stronger manufacturing activity. The USD took a dip after the jump in the unemployment rate which sent this pair above the 20 SMA briefly, but that was mainly due to the increase in the participation rate, so the USD reversed higher later in the day, sending AUD/USD to 0.6450 where it closed the week.
Australian Consumer Price Index Report for August 2023
- July CPI YoY 4.9% vs. 5.2% expected
- June CPI YoY was 5.4%
The headline inflation rate has recently dropped below 5%, and this could lead to the belief that the Reserve Bank of Australia (RBA) may have reached the peak of its tightening cycle. However, making further progress in the coming months could prove to be more challenging. Our prediction of a final 25 basis point (bp) interest rate hike in the fourth quarter of 2023 is now hanging by a thread.
In July, we saw a notable increase in electricity prices, with a 6.0% month-on-month rise, including the impact of rebates. Additionally, rents continued to rise at an accelerated pace. Despite these increases, the annual growth in overall housing costs remained relatively stable, registering a 7.3% year-on-year increase in July compared to 7.4% in June.
AUD/USD Live Chart
- Check out our free forex signals
- Follow the top economic events on FX Leaders economic calendar
- Trade better, discover more Forex Trading Strategies
- Open a FREE Trading Account