Forex Signals Brief September 19: Slight Retreat in the USD as We Await RBA Minutes and Canada Inflation
The RBA released it's meeting minutes earlier today, while later we have the last CPI reading from Europe and Canadian CPI inflation
Yesterday’s Market Wrap
The price action was pretty quiet yesterday, with most assets trading in a narrow range, as markets settled into the new week. Traders were adopting a cautious approach and are awaiting key central bank policy decisions and economic data releases later this week. Major central bank policy decisions are on the horizon, and this is likely contributing to the subdued trading activity.
Major currency pairs are characterized as trading within narrow ranges, although we did see a slight weakness in the USD, while the Euro enjoyed a rally. In contrast, Oil prices, such as US WTI and Brent crude, performed well and jumped above the $91 level. Additionally, 10-year Treasury yields are on the verge of potentially breaking out to their highest levels since 2007.
European indices were retreating ahead of the US open, but then the situation calmed as US traders came in. The ongoing strike by the United Auto Workers (UAW) icould be a factor affecting US stocks, which can influence market sentiment. But, that didn’t materialize yesterday.
Today’s Market Expectations
Today starts with the Monetary Policy Meeting Minutes from the Reserve bank of Australia, which held interest rates steady in the last meeting. Markets are not expecting anymore hikes from them which is dovish, but they can sound hawkish if they mention “higher-for-longer” on rates, meaning keeping them at current elevated levels for an extended period of time.
The final iconsumer inflation figures for August from the Eurozone will be released and both the headline CPI and core CPI (consumer price index) are expectedtoremain unchnaged at 5.3%, which won’t offer much relieff to the Euro. The Canadian CPI inflation for August will also be released and it is expected to show a slowdown to just 0.1% compared to 0.6% we saw in July, which would be beariish for the CAD.
Forex Signals Update
Last week markets were quiet until the release of the inflation report from the US, which supported the USD further, helping it with the larger bullish trend. We remained largely long on the USD, which proved to be a profitable strategy once again.
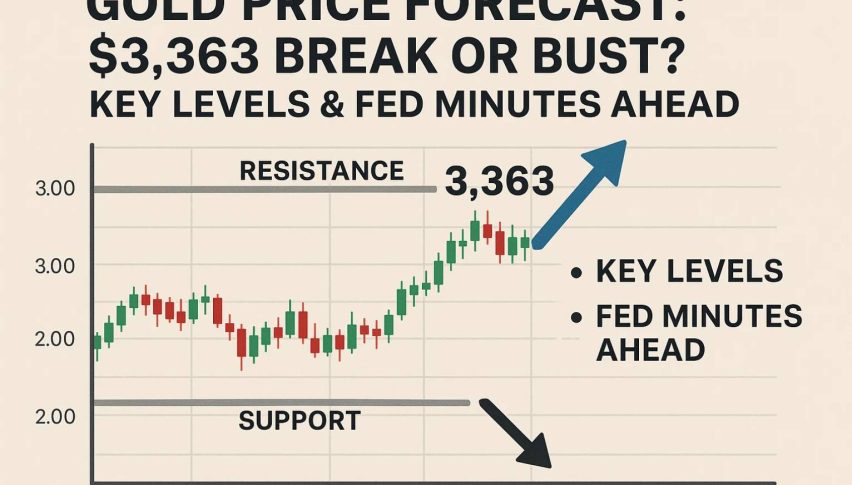
GOLD Continues the Bounce
Since failing to break the record highs earlier this year, Gold has been on a downtrend, and the 100-day Simple Moving Average (SMA), which is represented by the green line on the daily chart, has started to act as resistance. After the price bounced off the 200 daily SMA (purple) at the beginning of the month, we noticed a rejection at this moving average. Last week, Gold made its way back to this moving average, but we noticed another bounce from the 200 SMA, suggesting that buyers may be regaining control as the price forms higher lows. Yesterday the

XAU/USD – Daily chart
- Gold Sell Signal
- Entry Price: $1,906.34
- Stop Loss: $1,920.34
- Take Profit: $1,898.34
Will GBP/USD Bounce off the 200 SMA?
GBP/USD last week closed at 1.2480s, down around 8 cents from its top at about 1.3150. Although the price finally fell below 1.24 as the slide persisted. On the daily chart, we can see that the 200-day Simple Moving Average (purple) is present at this point. At the 1.2450 level, which has traditionally served as a strong support and resistance level, the drop came to an abrupt halt.
This level was breached and the downturn persisted even though there was no recovery from this support zone. The UK’s economic data is also supporting the negative trend in GBP/USD. The most recent jobs report included unfavorable findings such a higher unemployment rate, negative payroll change, and employment change.

GBP/USD – Daily chart
Cryptocurrency Update
BITCOIN Retaking the $27,000 Level Again
Bitcoin is showing signs of weakness again after the bounce early last week. Last week, cryptocurrency prices had a sharp downturn, falling under the $25,000 support level which is a big support and resistance level. We were waiting to see whether it would hold since it is a significant psychological threshold or if the decline would continue and result in further losses. BTC, however, abruptly reversed course last week, rising more over $1,500. The climb stopped for several days but yesterday buyers came back and gave BTC another push, sending it above $27,000.

BTC/USD – Daily chart
We are looking to open another buy Bitcoin signal yesterday after the pullback, going in long just above the 20 SMA on the daily chart above.
ETHEREUM Retesting the 20 Daily SMA
The price of Ethereum jumped higher last month indicating that there was a level of buying interest and demand for Ethereum at the sone around $1,600. Buyers have stepped in on several occasions at the area above this level but the 20 SMA (gray) has been acting as resistance on the daily chart. Although yesterday buyers had another go at this moving average and pushed the price above it for some time.

ETH/USD – Daily chart
- ETH Buy Signal
- Entry Price: $1,671.79
- Stop Loss: $1,371
- Take Profit: $1,971
- Check out our free forex signals
- Follow the top economic events on FX Leaders economic calendar
- Trade better, discover more Forex Trading Strategies
- Open a FREE Trading Account