Long on USD/CAD As Daily Chart Points to a Bullish Reversal
USD/CAD has retreated 3 cents lower but it seems like the pullback might have come to an end and a bullish reversal is underway
Risk sentiment has been negative for more than a year, as central banks kept raising interest rates, which has been keeping risk assets such as commodity dollars retreating. Earlier this year the sentiment was improving as the FED was giving signals of stopping rate hikes, but since July the decline in risk assets has resumed, with the FED giving signals for one more hike and keeping rates at elevated levels for longer.
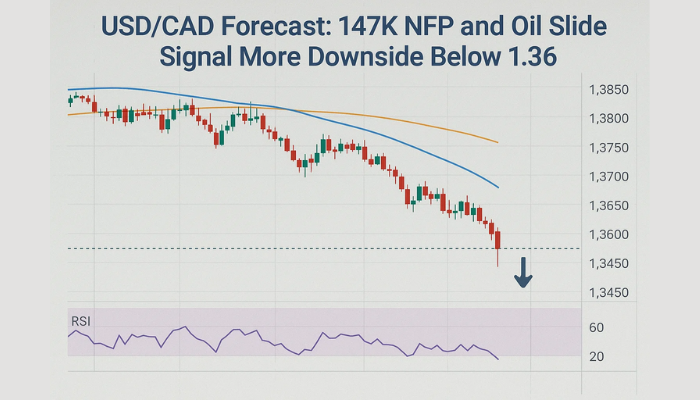
USD/CAD increased from around 1.31 to 1.37, as the USD benefited from such an environment. But in the last two weeks, we have seen an advance in commodity dollars and a retreat in the USD. The advance was more pronounced in the CAD, which also benefited from the surge in Oil prices, as WTI surged to $93.
The situation in China seems to be improving after the economic woes we saw, with huge bankruptcies in the property industry, while manufacturing and services also contracted. However, there has been government involvement and we are seeing some progress there as well. This month’s industrial output, manufacturing, and retail sales figures broke the downward trend, with the latter indicating strong domestic demand.
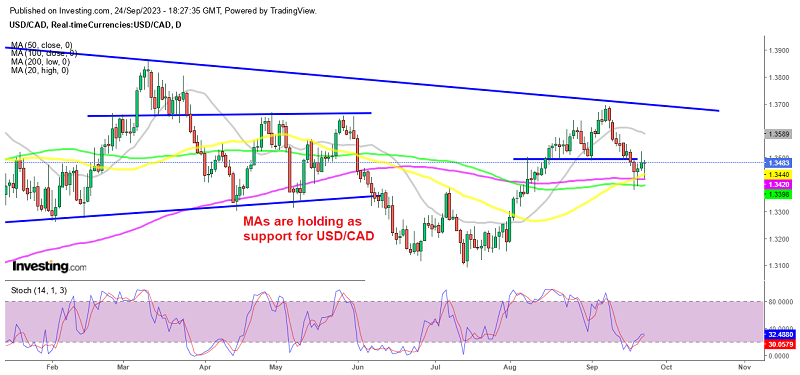
USD/CAD retreated around 3 cents lower and pierced below 1.34 and the moving averages, although there was no close below there. The daily candlesticks all closed above the moving averages which shows buying pressure around the 1.34 zone while can see a couple of doji/hammer candlesticks which are bullish reversing signals.
Besides that the price is oversold on the daily timeframe, as the stochastic indicator shows, so we decided to go long on this pair and open a long-term buy USD/CAD signal at the 50 SMA. Crude Oil also retreated more than 5 cents lower last week, which shows that sellers are starting to come in as we approach the $100 level in US WTI . So, a bullish reversing chart pattern is forming up in USD/CAD and we are long already.
USD/CAD Live Chart
- Check out our free forex signals
- Follow the top economic events on FX Leaders economic calendar
- Trade better, discover more Forex Trading Strategies
- Open a FREE Trading Account