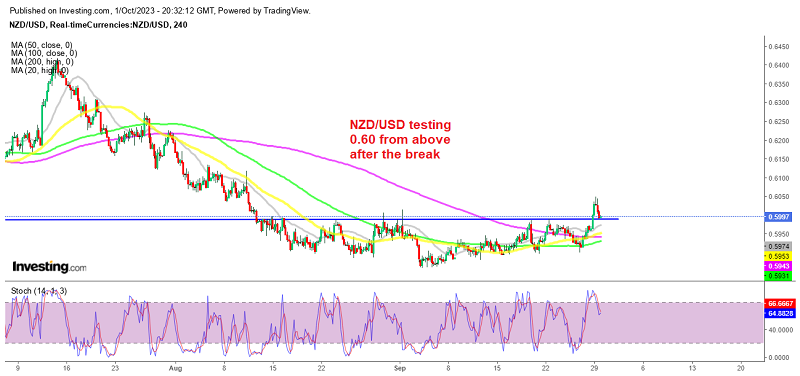
Will Resistance at 0.60 Turn into Support for NZD/USD?
NZD/USD pushed above 0.60 last week but retraced lower to this zone on Friday, but let's see if this level will hold as support

The New Zealand dollar has been decreasing since July as commodity dollars have fallen due to a stronger USD, as well as China’s economy displaying significant deterioration in several areas. The US economy, on the other hand, has shown resiliency, with Durable Goods Orders growing by 0.2%, beating the projected -0.5% previous week, and unemployment claims continuing to be low, indicating that the labor market is in excellent form.
On the daily chart, NZD/USD has retraced all the way back above the critical resistance level around 0.60, reaching o.6050 last week and then sold off as the USD received a boost from both the more bullish than expected FOMC dot plot and economic data. Although the main trend continues to be negative, but with the smaller moving average crossing might be an early hint of a bottom.
On the daily chart, the NZD/USD has retraced all the way back to the critical resistance level around the 0.60 handle and then sold off as the USD received a boost from both the more hawkish than expected FOMC dot plot and economic data. Although the trend continues negative, the smaller moving average crossing above the smaller ones might be an early hint of a bottom.
On the 4-hour chart, we can see that the last leg lower signaled a loss of momentum, which is usually followed by pullbacks or reversals. In this situation, we saw a retreat to the 0.60 barrier, but this zone held on Friday and if we see a reversal and move higher NZD/USD should be headed to the next resistance level around 0.6117. The price is currently testing a trendline, and we can anticipate buyers to enter with a defined risk below it in order to set for another rally into the resistance and aim a breakthrough. Sellers, on the other hand, will want to see the price break lower so that they may pile in even more and set a new low.
NZD/USD Live Chart
- Check out our free forex signals
- Follow the top economic events on FX Leaders economic calendar
- Trade better, discover more Forex Trading Strategies
- Open a FREE Trading Account


