Forex Signals Brief November 13: Plenty of Data to Rally Markets Around This Week
This week the economic data releases return, with the main event being the US CPI inflation report

Despite the bullish momentum in the stock markets last week, in the forex market, the sentiment was negative, with the USD recovering some of the losses from last week. The volatility in FX was moderate, with most majors declining against the buck. USD/JPY continued to approach the top of the range last week, and there was no significant threat of breaking the recent high of 151.74.

On Friday in particular, equity markets raced higher in nonstop bidding. The futures market gave little inkling of what was to come since it was only slightly higher too. As all chip firms climbed, one prominent narrative was Nvidia’s end-around on the Chinese semiconductor blockage, but the rise was broader than that.
Treasury rates continued lower for most of the week but made a sharp reversal on Thursday which erased almost all losses after some hawkish comments from FED’s Jerome Powell. The UMich consumer mood data, which featured hot inflation indicators, provided further support for the US dollar. The CAD did receive some independent support as Oil prices fell below $80 last week.
This Week’s Market Expectations
- Monday: Japan PPI.
- Tuesday: UK Jobs data, German ZEW, NFIB Small Business Optimism Index, US CPI.
- Wednesday: Japan GDP, Australia Wage data, China Industrial Production and Retail Sales, UK CPI, US PPI, US Retail Sales, PBoC MLF.
- Thursday: Australia Jobs data, US Jobless Claims, US Industrial Production, NAHB Housing Market Index, New Zealand PPI.
- Friday: UK Retail Sales, Canada PPI, US Building Permits and Housing Starts.
The economic releases pick up this week after having a very mild economic calendar last week, which left the volatility low in the forex market. We have some important releases from China, such as the retail sales and industrial production, while from the US we have the CPI (consumer price index0 inflation, which with likely decide the sentiment for the week.
last week the volatility remained low in the forex market, although we saw some major moves in Gold and Oil, which trended down as US bond yields surged higher on Thursday and the USD gained. We opened 15 trading signals with 10 of them closing in profit, while the other five closed in loss, giving us a 66/33% win/loss ratio.
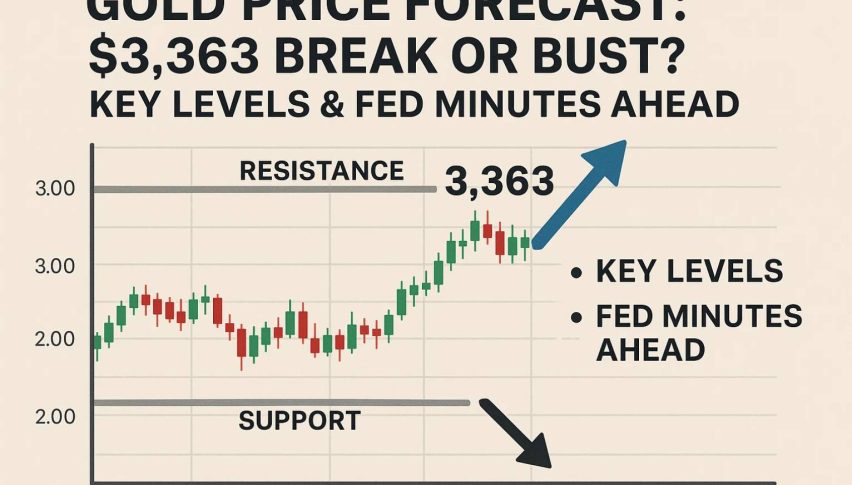
GOLD Tests MAs
GOLD (XAU/USD) was struggling to build any gains last week, reaching the lowest level since October 19. Since the start of last week, investors have been withdrawing from non-interest-bearing gold due to mixed indications from Federal Reserve officials about the rate rise trajectory. Concerns over the intensification of the Israel-Hamas war have diminished, which has lowered Gold’s appeal as a safe haven and now Gold is facing the 200 SMA 9purple) as support on the daily chart.

XAU/USD – Daily chart
- Gold Sell Signal
- Entry Price: $1,671.79
- Stop Loss: $1,371
- Take Profit: $1,971
EUR/USD Will Have to Fall Below MAs to Continue the Downtrend
Since reversing over 1.12 in July after failing to break above the 200 weekly SMA, EUR/USD has been bearish. The price dipped below 1.05 earlier this month but has since recovered, however, buyers are now facing the 100 SMA on the weekly chart, which is their first serious challenge.
EUR/USD – 240 minute chart
- EUR/USD Sell Signal
- Entry Price: 1.0673
- Stop Loss: 1.0633
- Take Profit: 1.0703
Cryptocurrency Update
BITCOIN Remains Well Supported as It Moves Higher
Bitcoin has continued to benefit from a more positive cryptocurrency environment, particularly since the Securities and Exchange Commission approved a Bitcoin spot ETF. As a result, late last month, this cryptocurrency soared, hitting $35,000 before weakening and collapsing. Despite not losing much ground, buyers took command of the situation and drove the price up to more over $36,000. BTC is presently trading around $35,000, and we witnessed another recovery off the 50 SMA (yellow) yesterday, with buyers stopping just below last month’s high of $38,000. 
BTC/USD – 240 minute chart
Boking Profit in ETHEREUM As It Reaches $2,000
After the SEC approved Bitcoin spot ETFs last month, Ethereum benefited from the good attitude in the crypto market and soared beyond $1,800, gaining more than $300. The zone around $1,700 became support, and it now seems that the 50 SMA (yellow) has also become support, which is fantastic. ETH/USD pushed above $2,000 yesterday, indicating that buyers are in charge and we booked profit on our Ethereum signal.
Ethereum – 240 minute Chart
- ETH Buy Signal
- Entry Price: $1,671.79
- Stop Loss: $1,371
- Take Profit: $1,971
- Check out our free forex signals
- Follow the top economic events on FX Leaders economic calendar
- Trade better, discover more Forex Trading Strategies
- Open a FREE Trading Account