Crude Oil Stalls at the 200 Daily SMA After Reversing Lower Today
Crude oil took full advantage of the war in Gaza, surging to $95. Although we have seen a reversal and a decline below $80 this month as ten
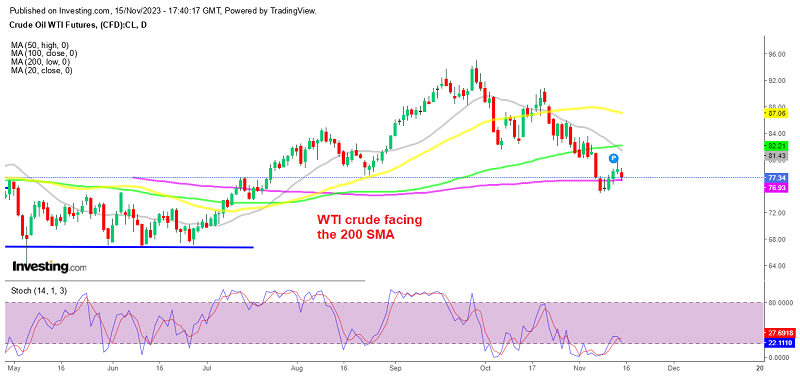
Crude oil took full advantage of the war in Gaza, surging to $95. However, we have seen a reversal and a decline below $80 this month as tensions did not appear to be growing further in the Middle East. On the daily chart, we can see that Crude Oil has lost all of its gains since the start of the Israel-Hamas conflict, indicating that the market is beginning to look past the conflict in the absence of additional escalation with Iran.
The break below the main support level of $83 and then pushing below the round level of $80 is significant, raising the prospect of additional declines. Early last week we saw a dip to $75, although the sentiment improved late last week and crude Oil reversed higher, with WTI getting to $79.80 but not quite reaching the $80 level. The price formed a doji candlestick on the daily chart, which is a bearish reversing signal nd today’s candlestick is looking bearish. Although sellers are facing the 200 SMA (purple) as support now, so the decline has stalled.
The EIA crude Oil inventories were announced earlier today, and they showed another buildup last week which was larger than expected. Although the decline has stopped, so we’ll see if there will be a bounce off this moving average.
US EIA Weekly Petroleum Inventory
- Weekly oil inventories +3600K vs +1793K expected
- Prior headline crude +774K
- Distillates -1400K vs -1242k expected
- Gasoline -1500K vs +622K expected
API data released late yesterday:
- Crude +1335K
- Gasoline +195K
- Distillates -1022K
Oil has ticked up on this data.
US WTI Crude Oil Live Chart
- Check out our free forex signals
- Follow the top economic events on FX Leaders economic calendar
- Trade better, discover more Forex Trading Strategies
- Open a FREE Trading Account