Signs of Bottoming Out in USD, As It Gains After Soft New Home Sales
Today began slowly, with markets and the USD showing a more mixed picture, as we saw a slight retreat earlier, but USD buyers have been comi
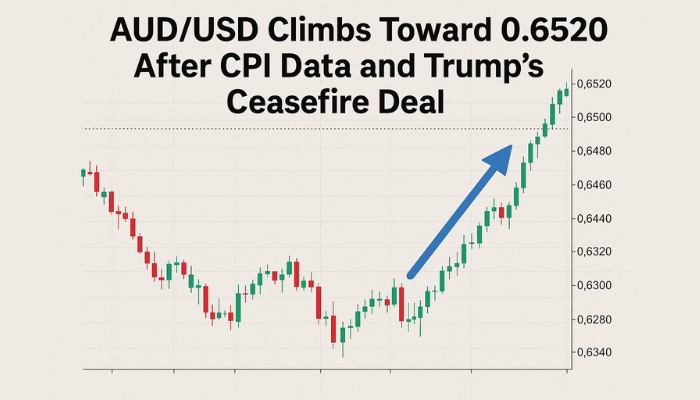
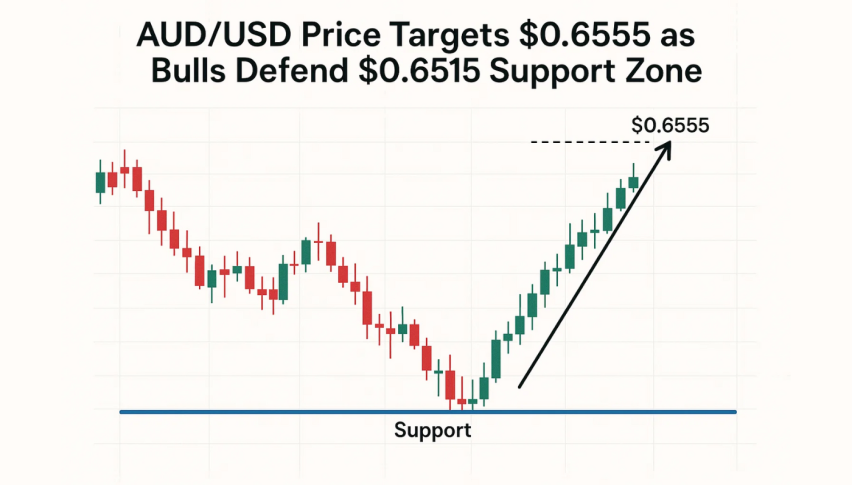
Today began slowly, with markets and the USD showing a more mixed picture, as we saw a slight retreat earlier, but USD buyers have been coming back now. As we move ahead in US trading, the greenback is starting to make a comeback against the main currency bloc. Commodity dollars were also taking advantage in the European session, with both the AUD/USD and the NZD/USD finally breaking critical resistance levels, with the former up 0.4% to 0.6615 and the latter up 0.5% to 0.6103.
But they have retreated lower somewhat, so we’re looking to open a buy signal in any of these two pairs. This comes as Treasury yields fall marginally but markets become more cautious. Stocks have been on a tear, gaining for four weeks in a row, but are expected to take a respite to begin the new week.
Earlier today we had the US New Home Sales for October, which cooled off more than expecations. Although there wasn’t any impact on the USD, since it has been claiming back some of the losses in the US session. This is a good sign for the Buck since it is not enduring any more losses on bad news. But, this might be just a slight retrace before the trend resumes, so for now we’re going with the flow and opening a buy AUD/USD signal.
US New Home Sales for October 2023![New residential sales]()
- New home sales 0.679M versus 0.723M estimate
- New home sales for October -5.6%
- Prior month 0.719M revised from 0.759M previously reported
- US homes for sale at the end of October 0.439 million units versus 0.433 million units in September
- New home sales supply 7.8 months in October from 7.2 months in September
- Median sale price $409,300 which is down -17.6% from October 2022
- average sale price of $487,000 versus $543,300 from October 2022
Regionally
- Northeast home sales -13.2%
- Midwest home sales -16.4%
- South home sales +2.1%
- West home sales -23.3%
- 2 year at 4.924% -3.6 basis points.
- 10-year is at 4.433% down -5.1 basis points.
Major US stock indices are mixed:
- Dow industrial average -50 points or -0.14% of 35339
- S&P index -5.61 points or -0.12% at 4553.30
- NASDAQ index unchanged at 14250.37
AUD/USD Live Chart
- Check out our free forex signals
- Follow the top economic events on FX Leaders economic calendar
- Trade better, discover more Forex Trading Strategies
- Open a FREE Trading Account


