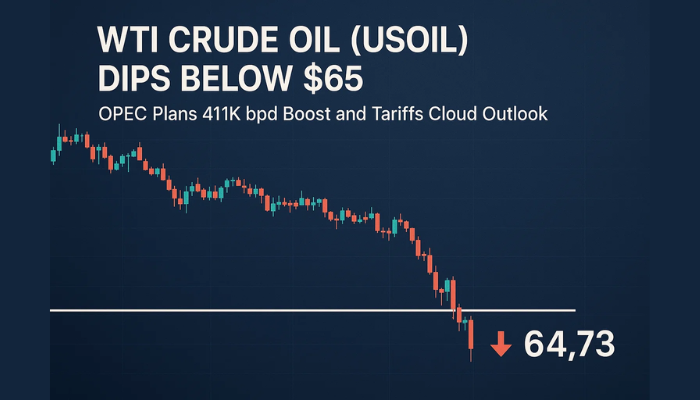
The 200 SMA Holds the First Test in Crude Oil
Crude Oil went through a bounce on Friday after forming a doji candlestick on Thursday, but it did close yet another week down, with losses
Crude Oil went through a bounce on Friday after forming a doji candlestick on Thursday, but it did close yet another week down, with losses of around $4. After buyers failed to hit $100/barrel in WTI earlier in the summer, the price has been falling rapidly since. OPEC has been attempting to keep the mood upbeat by extending output reduction into Q1 of 2024, but with the voluntary cuts, the market is not convinced and nothing is slowing the collapse in crude Oil.
After consolidating around the 50 SMA (yellow) on the weekly chart for several weeks, which stood around $75, WTI crude resumed the decline last week with the price falling below $70 on Wednesday. Sellers pushed it below the 200 SMA (purple) as well, but on Friday we saw a comeback, which I don’t think will last too long, so we’re preparing to open a long-term sell Oil signal a bit higher, probably around $72.50-$73.
The global economy has been showing increasing signs of weakness, so there’s not much to support Oil fundamentally. But Crude Oil has been sold off so aggressively recently that it was safe to go long above the $66-68 support zone. Besides that, the US administration announced an additional 3 million barrels of crude Oil purchases to refill the SPR on Friday, which was a minor positive catalyst because the White House may refill it at lower rates than they paid. That will increase the inventory and be another factor to keep Oil below $100, but the bulls will take whatever they can get at this point, so the $1,70 rally before the week closed was a boost.
But as we mentioned above, the global economic outlook doesn’t look favourable for Oil buyers. Chinese imports of Crude Oil declined by 9% in November compared to last year as Chinese demand for fossil fuels sumps alongside China’s growth metrics.
US WTI Crude Oil Live Chart
- Check out our free forex signals
- Follow the top economic events on FX Leaders economic calendar
- Trade better, discover more Forex Trading Strategies
- Open a FREE Trading Account


