First Test for Crude Oil Buyers After Bullish Reversal Pattern
Crude Oil has been falling since September after WTI failed to hit $100 per barrel and dipped below $70, with highs getting lower and moving
Crude Oil has been falling since September after WTI failed to hit $100 per barrel and dipped below $70, with highs getting lower and moving averages acting as resistance indicators during retraces higher. Now Oil has entered a bearish zone, but in the last few days, we have seen some demand return, after tensions in the Middle East.
So, crude Oil has been rising recently after approaching the support zone around $67 last week, however, it remains broadly under pressure after plummeting 20% since October. There are some factors going in favor of Oil right now, but I don’t think the bullish momentum is sustainable since fundamentals continue to get weaker for Oil.
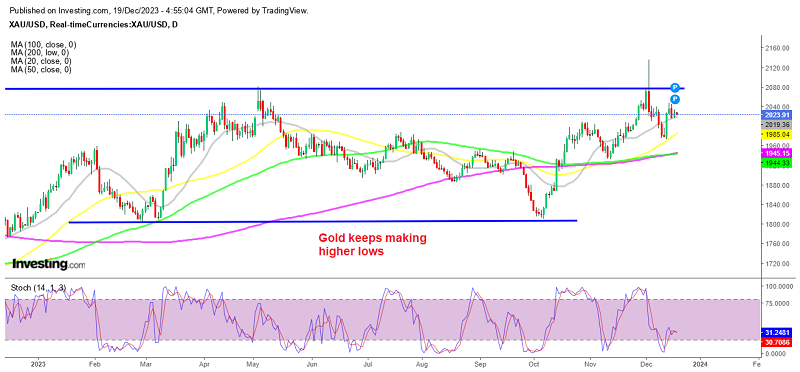
WTI Oil Daily Chart – The Climb Stopped at the 20 SMA Yesterday

There is still a lot of uncertainty and disagreement for Oil, particularly, surrounding the demand picture for next year. On One hand, the likelihood of a steep policy easing by the FED and other major central banks has increased the odds of a softer landing, which might stimulate demand, so this might be one factor in the climb in recent days.
Another factor has been the tensions in the Middle East. The Oil giant BP said that it will halt all supplies across the Red Sea due to escalating attacks on vessels by in Yemen, which also contributed to the jump we saw yesterday. UK Brent Oil and WTI crude were both up 3.5% to $79 and $74 per barrel, respectively
On the other hand, markets are also concerned about a possible reduction in petroleum demand, particularly in China, where the economic data keeps giving signs of a slowing economy. However, the weekly Oil chart at the top shows that WTI is finding support at the 200 SMA (purple), which has been holding several times during pullbacks lower since April. Besides that, the stochastic indicator is oversold and last week’s candlestick formed a hammer, which is a bullish reversing signal after the retreat.
US WTI Crude Oil
WTI
- Check out our free forex signals
- Follow the top economic events on FX Leaders economic calendar
- Trade better, discover more Forex Trading Strategies
- Open a FREE Trading Account